Frequency Scan
Frequency scans show how a system under study responds to an injected current at increasing frequency. The output of a frequency scan is a plot of per unit voltages, per unit currents, or both. From these plots, you can derive results such as voltage and current amplification, resonant points, and natural filter points. Frequency scanning utilizes a 1.0 per unit current injection at a single, user-selected location. Since Z=V/I, a 1.0 per unit current makes Z=V. Therefore, the bus voltage at the point of injection is the driving point impedance.
To obtain a frequency scan at a bus by injecting current at the same bus, double-click on the bus while in the Harmonics focus. This displays a window with a plot and spreadsheet as shown below. To obtain a frequency scan at a bus by injecting current at another bus, you need to define plots. The scan of bus at which current is injected appears on the AutoPlot tab.
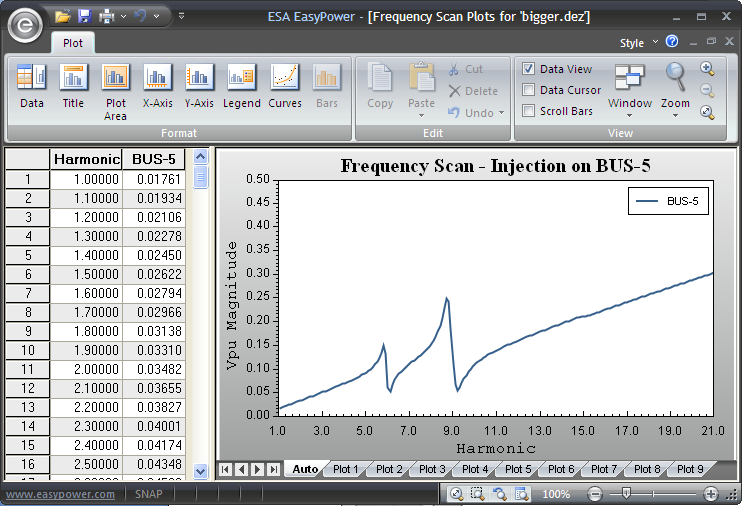
Figure 1: Frequency Scan at a Bus
The plot feature in the Harmonics focus enables you to select as many as ten plots with up to five buses or items each. For buses, the per-unit voltage is plotted; and for branch items, the per unit current is plotted.
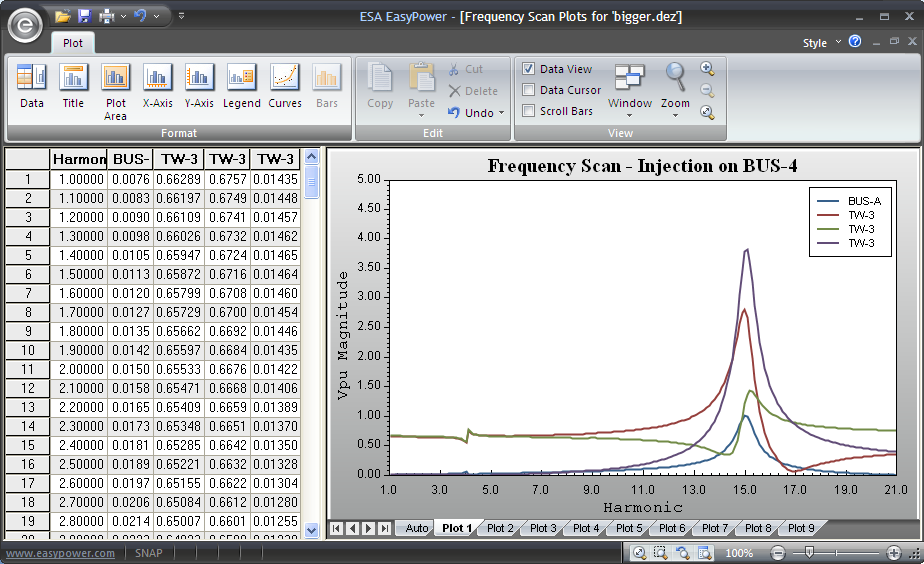
Figure 2: Plot Viewing Window
Defining a Plot
To enter the Define Plot mode:
- Click
 Define Plots. This activates the Plot Define tab and provides the plot
  Select pointer.
 - In Plot to Define, select a plot.
- Select up to five bus or branch items to plot. You can select new items without deselecting others by holding down SHIFT as you click. Click
 Add or
  Remove to add or remove items from the plot.
 - Click Plot to Define and select another plot, until all desired items are assigned to one plot or another.
- To clear the selections on a plot, click
 Clear. To clear the selections on all plots, click
  Clear All.
 - To exit Define Plot Mode, click
 Close.
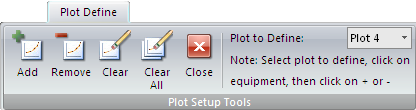
Figure 3: Plot Define Tab
Performing a Frequency Scan
- Click
 Harmonic Options and click the Plot Output tab. In the Frequency Scan Range section enter the range and step size of frequencies to be scanned.
 - Click the Text Output tab and check any text reports for output, and then click OK.
- Use Define Plot to add or remove items to be plotted.
- Select the bus where harmonic current is to be injected, and then click
 Scan. EasyPower performs the frequency scan and opens the plot viewer. You can also double-click the bus to injection on.
Tip: You can also open the dialog to format text output by clicking  Harmonics Reports.
Note: The plot viewer is limited to 5000 data points per item. Selecting a very small step size (for example, 001pu) may limit the scan range and increase computer processing time.
Tip: When the scan range is already set and there are no plots defined, you can automatically plot the voltage for a bus by double-clicking on that bus.
More Information
| Harmonics with Spectrum™ | |
| Tutorial - Harmonics Analysis |
|
|