Tutorial - Transient Motor Starting (TMS)
The Transient Motor Starting (TMS) feature of EasyPower enables you simulate various power system events like motor starting, device switching, and bus faulting. It supports calculating voltage, current, speed, torque, and power for motors at various locations using EasyPower’s dynamic models. These calculated values are shown in time plots, spreadsheets and the one-line.
Note: If you have purchased only the Transient Motor Starting module and not the Dynamic Stability module, your menus and options will reflect the names "Transient Motor Starting" or "TMS" instead of Dynamic Stability.
To perform the steps in this tutorial, open the DSExample-1.dez file.
- From the File menu, click Open File.
- Open the DSExample-1.dez file in your Samples directory.
- Click
 Maximize on the one-line window, if needed, to fill the session window with the one-line.
Tip: If you are viewing the Start Page, you can click Open One-line instead.
TMS Data
Items on the one-line must have TMS data before you can run dynamic simulations.
- Double-click on the motor M-1 to open the Motor Data dialog box and set the TMS data, as follows:
- Select the Stability tab and select the Enable Motor Model check box.
- In the Motors section, select (Generic) for Mfr and Std Ind for Type as shown in the figure below.
- Click
 Library to import the motor stability data from the library.
 - A message is displayed asking if you want to overwrite EFF and PF with Dynamic Data. Click No. This retains the efficiency and power factor data from the specifications tab.
- Under
Motor Starting Load, select Generic for Mfr and Std T vs Speed for Type, and then click
Library to import the data.
- Under
Motor Running Load, select Generic for Mfr and Std T vs Speed for Type, and then click
Library to import the data.
- Click OK. The motor symbol on the one-line changes to that shown in Figure 2 below.
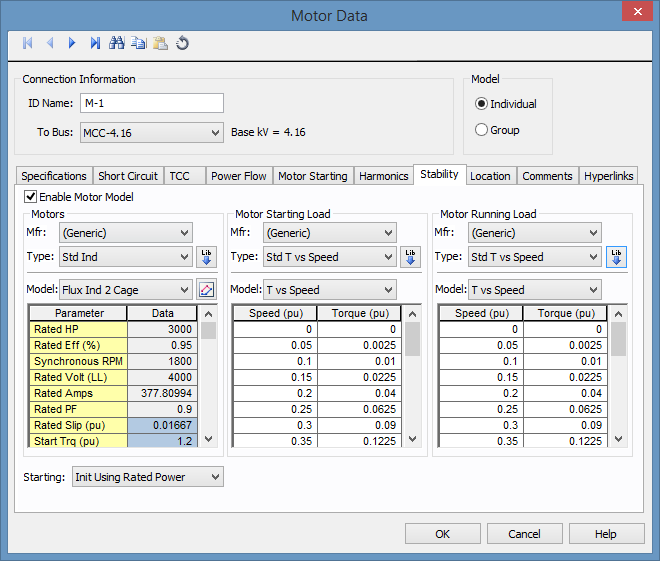
Figure 1: Motor Stability Data
- Load Stability data for motor M-2, just as you did for M-1 above.
- To display the ID Names for breakers on the one-line, in
Tools > Options > Text Visibility, in the Show Name For column, select the HV Breaker check box if it is not already selected.
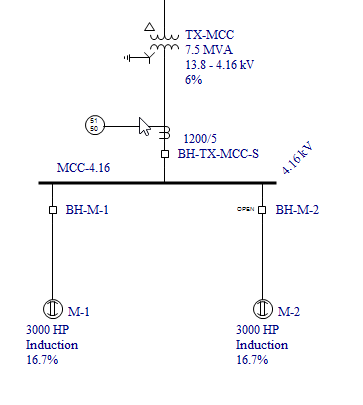
Figure 2: Motor Symbols in One-line
Running a TMS Simulation
Note: If you have purchased only the Transient Motor Starting module and not the Dynamic Stability module, your menus and options will reflect the names "Transient Motor Starting" or "TMS" instead of Dynamic Stability.
- From the Home tab, open the Dynamic Stability focus by clicking
 Stability. The Stability tab is displayed as shown in Figure 3 and the windows
are arranged to view the one-line, the simulation plot and message log. As you enter the Dynamic Stability focus, EasyPower
runs a power flow solution for steady state. Note the power flow results on the one-line.
Stability. The Stability tab is displayed as shown in Figure 3 and the windows
are arranged to view the one-line, the simulation plot and message log. As you enter the Dynamic Stability focus, EasyPower
runs a power flow solution for steady state. Note the power flow results on the one-line.
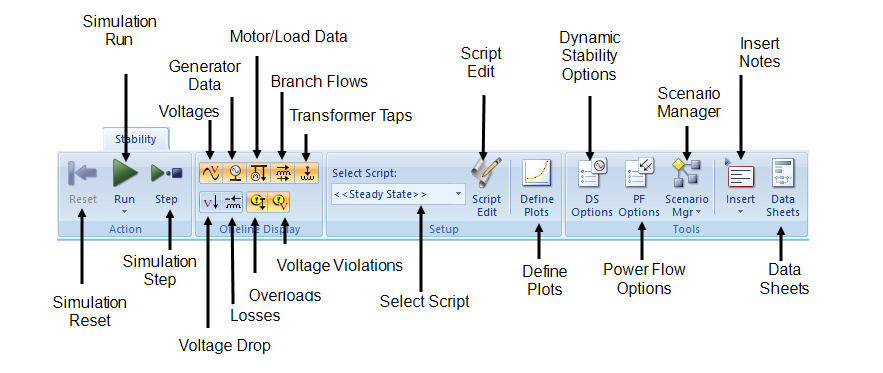
Figure 3: Dynamic Stability Tab
- To simulate starting the motor M-2, double-click on the breaker BH-M-2. The EasyPower window is displayed as
shown below.
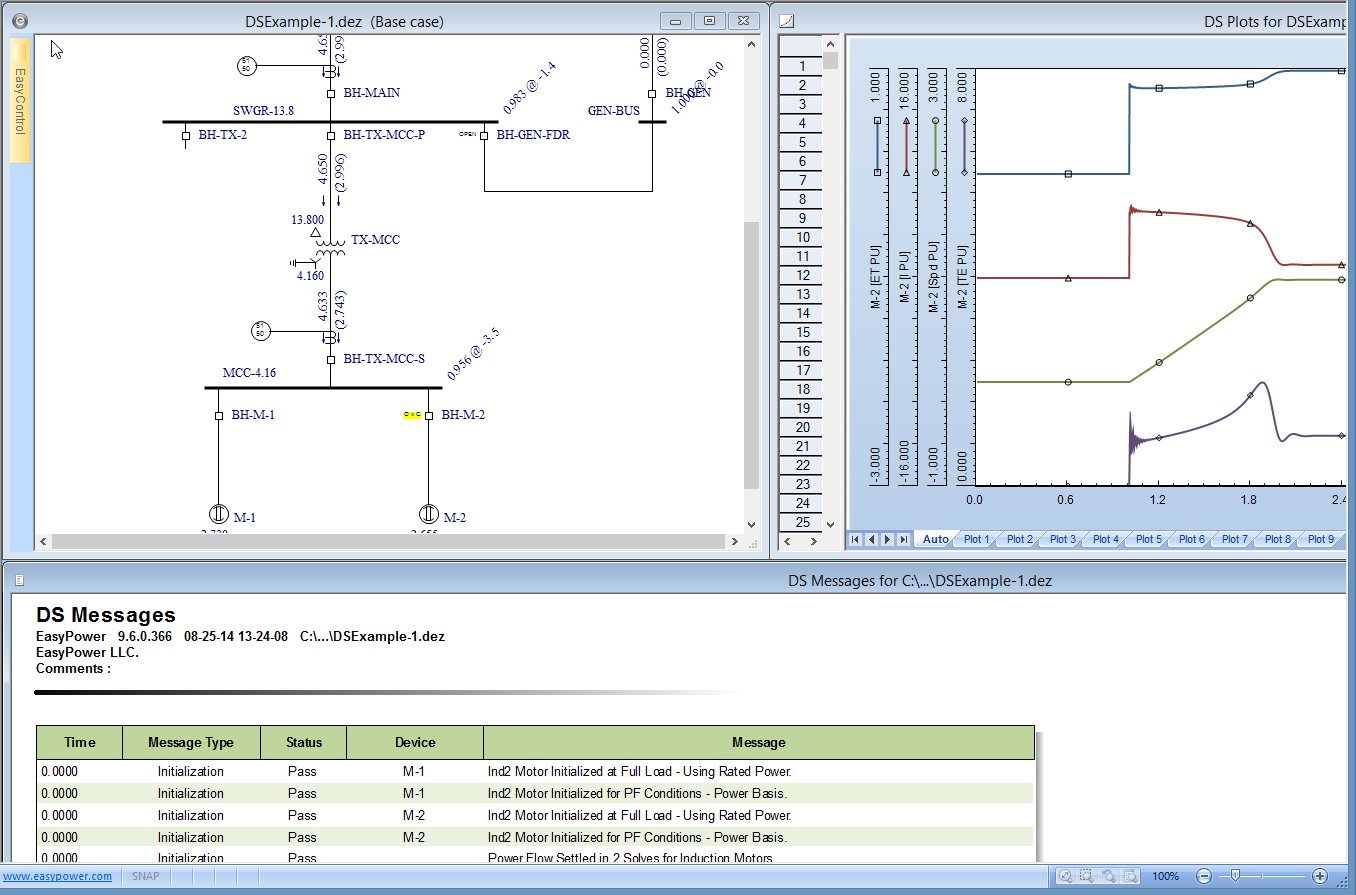
Figure 4: Motor Starting Results
The one-line shows the power flow results at the end of the simulation. The plot on the right shows values of motor voltage, current, speed and torque plotted against time. The message log window at the bottom describes what processes or events occurred. To view the spreadsheet data for this plot, you can drag the splitter bar at the left edge of the plot area to the right. You can format the plot axes or the plot area by double-clicking on the item.
Note: To perform any simulation commands, the one-line window needs to be the active window. If the title of the one-line window is not highlighted, click the one-line window once to make it active.
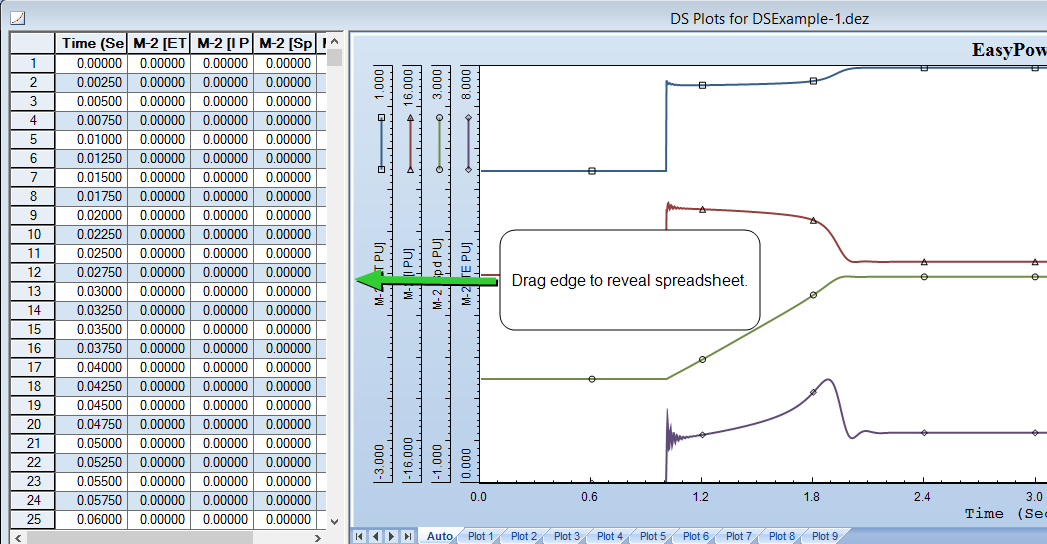
Figure 5: Simulation Data in Spreadsheet
Dynamic Simulation Options
Note: If you have purchased only the Transient Motor Starting module and not the Dynamic Stability module, your menus and options will reflect the names "Transient Motor Starting" or "TMS" instead of Dynamic Stability.
Click on the one-line window and select
 DS Options from the
Stability tab. You can control the simulation through options in this dialog box.
DS Options from the
Stability tab. You can control the simulation through options in this dialog box.
In the Double-Click tab, note the controls for Breaker or Switch to Close. The default values are 6 seconds for Simulation End Time and 1 second for Delay Time Length. In the plot from the previous simulation, notice that the breaker BH-M-2 closed one (1) second after the start of the simulation, and the simulation plot ends at 6 seconds. You can control other double-click actions like bus faulting and ATS transfer in the same way.
Plotting User Selected Values
When you perform a simulation by double-clicking on the one-line, data is plotted in the AutoPlot tab. Based on the type of simulation, EasyPower chooses which values to display in the AutoPlot. In the previous example, the plot was provided with motor per-unit values for voltage, current, speed and torque. To see values elsewhere in your system, you need to define plots. Nine plots are available with up to a maximum of 5 curves per plot.
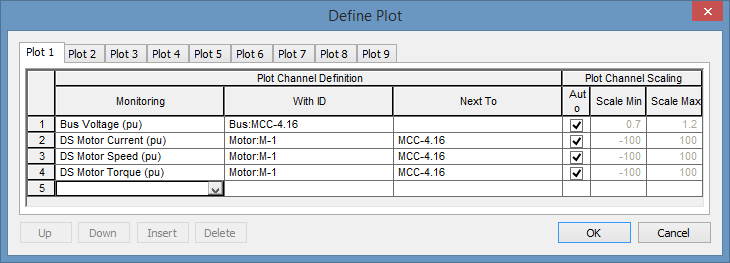
Figure 6: Defining Plots
- To define a plot, ensure the one-line is selected, and then click
 Define Plots. When motor M-2 starts, the voltage dip affects values at motor M-1. In Plot 1 we
view voltage, current, speed and torque for motor M-1.
Define Plots. When motor M-2 starts, the voltage dip affects values at motor M-1. In Plot 1 we
view voltage, current, speed and torque for motor M-1. - Select values to plot by selecting the fields for Monitoring, With ID and Next To, as shown in the figure above. Values can also be selected by first selecting an open Monitoring cell, right-clicking on motor M-1 on the one-line, and then selecting the desired value type to be plotted with the Define Plot dialog box open. Click OK to close the Define Plot dialog box.
- Click
 Reset Simulation to reset to steady state prior to any dynamic simulation. Start motor M-2 again by double-clicking on breaker BH-M-2. Click the Plot 1 tab to view the simulation results.
Running a Simulation From Scripts
You can write scripts to simulate various events and run them sequentially. Before we run scripts, we need to define plots so we can view results for the desired values. Next, we will write a script to simulate steady-state for 2 seconds, starting motor M-2, and switching off motor M-1.
- First define Plot 2 to view speed, torque, current and voltage for motor M-2, all values in per-unit, as you did for M-1 above.
- To write a new script:
- Ensure the one-line is selected, and then click
 Script Edit.
 - Click New to add a new script.
- Type Start M-2 and Stop M-1 as the name of the new script. Add commands to the script as shown in the figure below.
- Click OK in the Edit Script dialog box.
- Click Close in the Scripts dialog box.
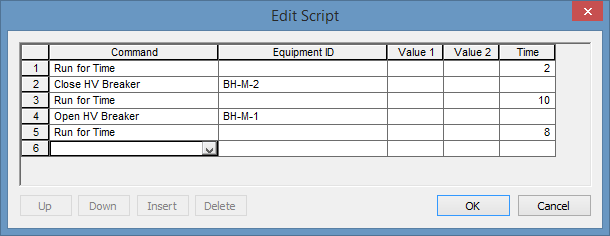
Figure 7: Script Example
- Ensure the one-line is selected, and then click
- In the Select Script box in the Stability tab, select the Start M-2 and Stop M-1 script.
- Click
 Run Simulation. View Plot 1 and Plot 2 of the plot window to see the results.
Simulating Faults
On the one-line window, double click on bus MCC-4.16. This runs a simulation of a 3-phase fault on this bus. The fault impedance and duration can be specified in DS Options > Double-Click tab. If you have the PowerProtector™ coordination feature enabled, TMS can simulate the response of a power system to a fault condition by causing protective devices to trip based on time-current curves. Notice the “C>>O” (closed-to-open) symbol on the tripped breaker in the one-line and the fault current dropping to zero in the AutoPlot. The Plot 1 tab shows motor M-1 fault current contribution and its subsequent spin-down after fault clearing.
Conclusion
This has been a brief tutorial on EasyPower’s TMS program. The EasyPower Help topics cover this and other features in greater
depth. To open Help, click  Help in the upper-right corner of the EasyPower window or press F1.
With PowerProtector™, you can also simulate contactors dropping out because of excessive voltage drop, or an ATS switching to emergency power. Remember to enter data in the Stability tab of the various equipment data dialogs as necessary in the Database Edit focus first. Make use of scripts to simulate sequential events and use the Define Plots feature to monitor values.
More Information
| EasyPower® Tutorials |
|
|