Click Power Flow > PF Options (toolbar menu: Tools > Power Flow Options), and click the Control tab to specify the behavior of a power flow study.
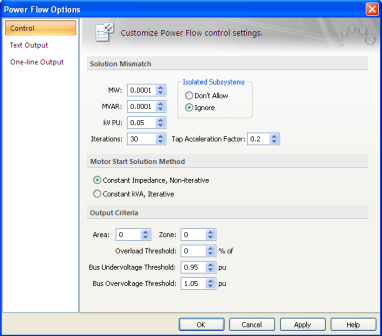
Figure 1: Control Tab of Power Flow Options Dialog Box
Solution mismatch controls the tolerance of power flow convergence and how long convergence will take. The smaller the mismatch, the more difficult it becomes to make power flows and voltages converge to a solution.
MW: Convergence tolerance of the bus megawatts. Flows into a bus converging to within this tolerance of the actual load on the bus is considered to be an acceptable solution. The default setting of 0.0001 MW (100 watts) is an extremely accurate tolerance.
MVAR: Convergence tolerance of the bus megavars. Flows into a bus converging to within this tolerance of the actual load on the bus is considered to be an acceptable solution. The default setting of 0.0001 MVAR (100 vars) is an extremely accurate tolerance.
kV PU: This field determines the bus voltage tolerance for generator PQG buses that switch back to PV buses. Bus voltage must converge to within this tolerance of the actual load on the bus to be an acceptable solution.
Iterations: Number of solution iterations allowed for convergence. For most typical industrial systems, only five to six iterations are required for convergence. If many load tap changers or tighter controls are used, 10-15 iterations may be required.
Isolated Subsystems: All power flow solutions require a swing (slack) source to account for system losses, etc. (see Swing Sources). To solve an isolated system requires you or the program to add a swing source. An isolated subsystem is when a portion of the one-line is separated from the main part and does not have its own swing source (see below). This typically occurs when you open a feeder breaker on a radial line or transformer. It may also occur when opening multiple breakers on more complicated looped systems.
Tap Acceleration Factor: Factor used to slow speed through iterations by changing LTC of transformer when changing taps.
Motor Start Solution Method controls the algorithm used, and the way loads are modeled when motors are started in the power flow analysis.
Constant Impedance, Non-iterative: A direct solution method using the admittance matrix and voltages from the existing power flow solution. All constant kVA and current loads are converted to constant impedance loads for this method. Starting motors are also modeled as a constant impedance. The advantages of this method are its speed since the solution is direct (no iterations are required), and the fact that it cannot diverge. The disadvantage is that it may be non-conservative depending on the solution voltages. The reason for this is that constant impedance loads are a function of the square of the voltage. As the system voltage is reduced, the load is proportionally reduced also, effectively reducing the load.
Constant kVA, Iterative: An iterative method using the same algorithm as the power flow solution. All constant kVA, current, and impedance loads remain modeled as they are in a standard power flow solution. Starting motors are modeled as a constant impedance. The advantage of this method is its accuracy since it correctly models all load types. The disadvantage is that it can diverge (fail to solve) if the voltages become too low, or the loads are too high.
Area: Enables you to specify a specific bus area that will be reported in text results.
Zone: Enables you to specify a specific bus zone that will be reported in text results.
Overload Threshold: Sets the limit for flagging overload violations. Equipment items not in violation, yet within this threshold %, are highlighted for easy identification. This setting applies to both one-line output and text result output.
For example, suppose a cable rated for 500A is loaded to 480A, and the Overload Threshold is set to -10 percent. The percent overload is determined as follows.
Note that the overload is negative, indicating that while the cable is not overloaded, it is 6 percent over the threshold limit of 10 percent. Therefore, it will be highlighted on the one-line when you click Overloads (toolbar menu: View > Overloads).
You can also display the overload as a percentage of the equipment rating. To use this option, in the Database Edit focus, select Tools > Options, click System and select the Use 100% convention for displaying analysis overloads/overduties check box.
Bus Undervoltage / Overvoltage Threshold: Sets the minimum and maximum limit for determining voltage violations. Bus voltages that either exceed the maximum limit or drop below the lower limit are in violation. Buses in violation are highlighted on the one-line and printed in voltage violation text reports.
Note: Text output is independent of one-line output. This means you can be viewing specific power flow results or attributes directly on the one-line, but displaying entirely different results in the text result windows.
Click Power Flow > PF Options (toolbar menu: Tools > Power Flow Options), and click the Text Output tab to determine the type of results that are displayed on the one-line during a power flow analysis.
Alternatively, in the ribbon style, you can click Power Flow and then click PF Text Reports. Text outputs are displayed in individual result windows which you can scroll, review, and print at your discretion. A detailed power flow result window and a summary window are available. Because of the many text output combinations, you are encouraged to try different options and levels of detail for your particular study requirements.
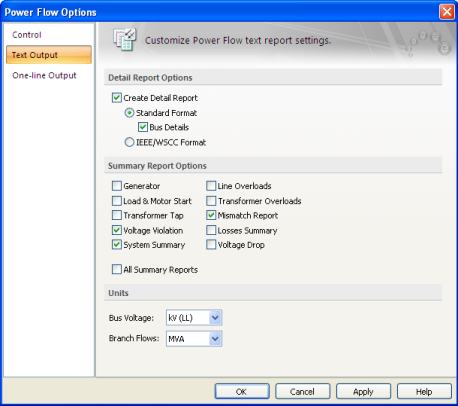
Figure 2: Text Output of the Power Flow Options Dialog Box
Detail Report Options: You can choose from two different detailed power flow result formats. The IEEE/WSCC Format may be familiar to you; however the Standard format provides the most detail. If you prefer to look at just the one-line output and no detailed text results, select None.
Summary Report Options: The summary window enables you to look at detailed summaries for specific equipment types or conditions. You can select all the reports at one time using the All Summary Reports check box.
Units: Choose between kV(LL) and V(LL) for voltage units and choose between MVA and kVA for branch flow units of the text report output.
Note: Text output is independent of one-line output. This means you can be viewing specific power flow results or attributes directly on the one-line, but displaying entirely different results in the text result windows.
Click Power Flow > PF Options (toolbar menu: Tools > Power Flow Options), and click the One-line Output tab to determine the type of results that are displayed on the one-line during power flow analysis.
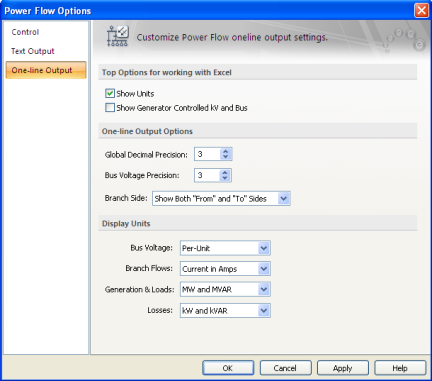
Figure 3: One-line Output of the Power Flow Options Dialog Box
Show Units: Enables you to display units of branch flows and bus voltages.
Show Generator Controlled kV and Bus: Enables you to display the generator controlled bus and the voltage in kV. Generator power flows are always shown.
Global Decimal Precision: This sets the number of digits past the decimal point for values displayed on the one-line. This affects all results except bus voltage.
Voltage Decimal Precision: This sets the number of digits past the decimal point for bus voltage values displayed on the one-line.
Branch Side: You can choose to display both "From" and "To" branch flows or you can optionally restrict the display to just "From" or "To" the bus.
Bus Voltage: Voltages can be displayed in either physical units kV(LL) or V(LL) or in per-unit values.
Branch Flows: Branch flows can be displayed in any of the following units:
Generation & Loads: Enables you to choose generator output and loads to be shown as any of the following:
Power Unit: Generation, branch flows, or loads can be displayed in either kVA or MVA units.
Losses Unit: System losses can be displayed in either kW and kVAR or MW and MVAR units.
| Power Flow Analysis | |
| Controlling the Analysis |