You can plot motor starting curves on the TCC plot by:
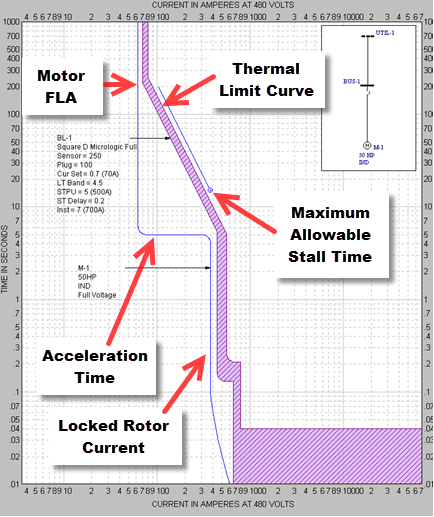
The plot below shows a motor starting curve for a 50 HP motor as well as a solid state trip curve for a breaker. The motor starting curve parameters are specified in the Motor Data dialog. After plotting the TCC, you can open the Temporary Motor Data dialog and change the parameters for the motor starting curve.
Figure 1: TCC Plot for 50 HP Motor Start
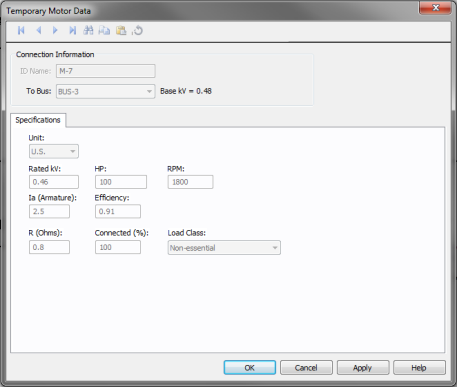
Figure 2: Temporary Motor Data Dialog for TCC
When plotting the starting curve for grouped motors, you need to specify the largest motor size in addition to other data required for individual motors. The plot assumes that the largest motor is starting and the rest of the motors are already operating at steady state. The current in the plot is calculated as follows:
During Acceleration:
Total Amps = Locked rotor amps of largest motor + FLA of the rest
After Acceleration:
Total Amps = Total FLA of all the motor
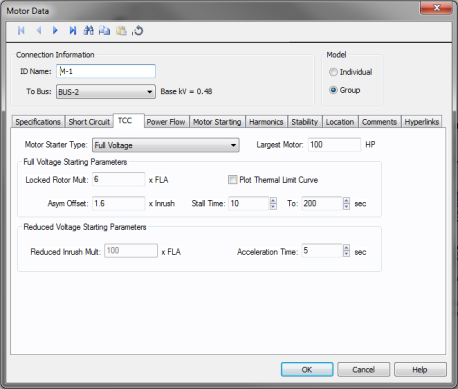
Figure 3: Grouped Motor Data
The following plot shows the starting curves of two motors:
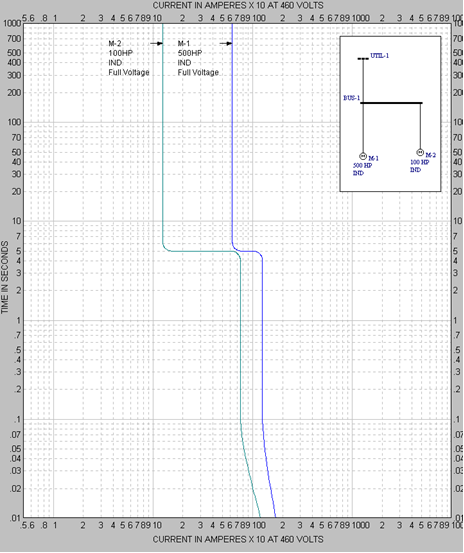
Figure 4: TCC Plot for 100 HP Individual Motor and 500 HP Grouped Motor
| Coordination with PowerProtector™ | |
| Plotting a TCC Curve from a One-Line | |
| Plotting Items in MCCs and Panels |