 Maximize to fill your screen with the one-line.
 Harm (
Harmonics) on the ribbon to open the Harmonics focus. A new ribbon appears with buttons that are used in the harmonics
calculations.
Harm (
Harmonics) on the ribbon to open the Harmonics focus. A new ribbon appears with buttons that are used in the harmonics
calculations.In this tutorial, you will be shown how to use several of harmonics analysis features in EasyPower Spectrum™. Three features are covered in particular:
To run harmonics analysis, you must be in the Harmonics focus.
Maximize to fill your screen with the one-line. Harm (
Harmonics) on the ribbon to open the Harmonics focus. A new ribbon appears with buttons that are used in the harmonics
calculations.Click
 Summation. Total harmonic distortion values are displayed on the one-line as shown in the figure below.
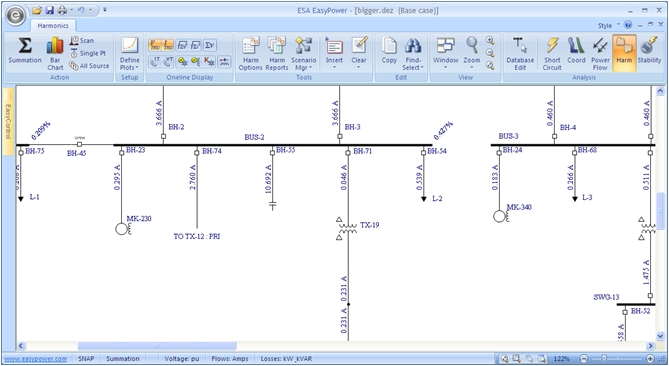
Figure 1: Harmonic Distortion Calculations
By default,
 Current Total Harmonic Distortion and
 Voltage Total Harmonic Distortion are selected. The vertical and horizontal numbers on the one-line
indicate I
THD and the diagonal numbers on the buses indicate V
THD.
Voltage Total Harmonic Distortion are selected. The vertical and horizontal numbers on the one-line
indicate I
THD and the diagonal numbers on the buses indicate V
THD.
In the example above, the I
THD through the capacitor on BUS-2 is 10.692 amps. The V
THD on BUS-2 is 0.427%. (The current and voltage units can be modified in the
 Harmonics Options > One-line Output tab.)
 Current Root-Sum-Squared and
 Voltage Root-Sum-Squared display I
RSS and V
RSS values on the one-line. These currents and voltages, which include fundamental and harmonics, are equivalent to I
RMSM and V
RMS. In the Harmonics focus, the fundamental voltage at each bus is assumed to be 1 per-unit. (This can be modified in
Harmonics Options > Control.) The fundamental currents for each equipment item are assumed to be either the
full load current rating of the equipment or the calculated current at 1 per-unit voltage.
Voltage Root-Sum-Squared display I
RSS and V
RSS values on the one-line. These currents and voltages, which include fundamental and harmonics, are equivalent to I
RMSM and V
RMS. In the Harmonics focus, the fundamental voltage at each bus is assumed to be 1 per-unit. (This can be modified in
Harmonics Options > Control.) The fundamental currents for each equipment item are assumed to be either the
full load current rating of the equipment or the calculated current at 1 per-unit voltage.
Additional summation information is also available for one-line display:
 IT Product and
 kVT Product indicate interference that could occur on a nearby telephone circuit.
 Voltage Sum determines peak voltage for comparison with equipment (for example, capacitor) peak voltage capability.
 Losses indicates the sum of fundamental and harmonic losses on individual equipment.
 Transformer K-factor and
 Conductor Derating determines the maximum fundamental load that can be supplied to a conductor with harmonics
present.
Conductor Derating determines the maximum fundamental load that can be supplied to a conductor with harmonics
present.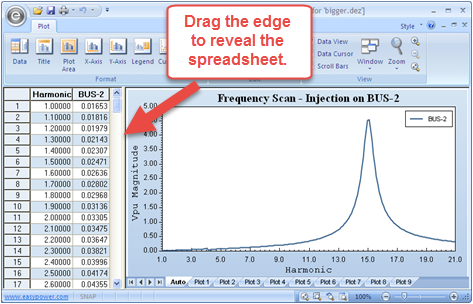
Figure 2: Frequency Scan
This frequency scan, by default, is based on a 1.0 per-unit current injection on BUS-2. The scan displays the BUS-2 per-unit voltage with respect to the harmonic frequency of this injected current. This per-unit voltage can also be considered a per-unit impedance as long as the current injection remains 1.0 per-unit.
 Close button on the top right of the window to close the plot window. This returns you to the one-line.
 Summation Bar Chart on the Harmonics ribbon.
This opens a bar chart that displays the different harmonics present in the buses (voltage) or branches (current).
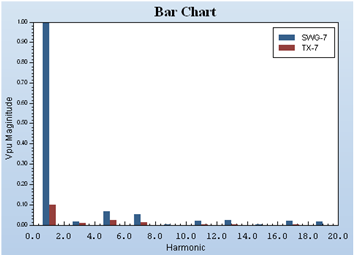
Figure 3: Harmonics Bar Chart Example
There are two distinct methods for harmonic current flow solutions:
 Single Pt (
Single Point Current Flow). Your one-line should display the values shown in figure below.
Single Pt (
Single Point Current Flow). Your one-line should display the values shown in figure below.
The Single Source Current Flow displays currents and voltages throughout the system based on a single harmonic current injection at a bus. In the case above, 1.0 per-unit (or 481 amps) of 5 th harmonic current are injected into BUS-2. The resultant 5 th harmonic current (in amps) and voltage (in system per-unit) are displayed on the one-line. (The units and injection current can be modified in the Harmonics Options dialog.) This information is useful for determining how a particular harmonic current will flow and what equipment will be affected.
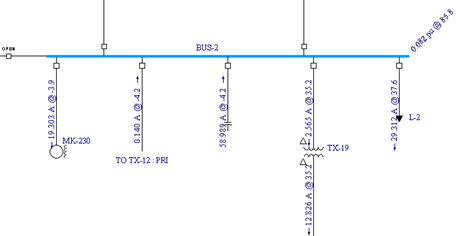
Figure 4: Fifth Harmonic Current Flow Based on BUS-2 Injection
 Find-Select.
  All Source (
All Source Current Flow). Your one-line should look similar to the figure below.
All Source (
All Source Current Flow). Your one-line should look similar to the figure below.
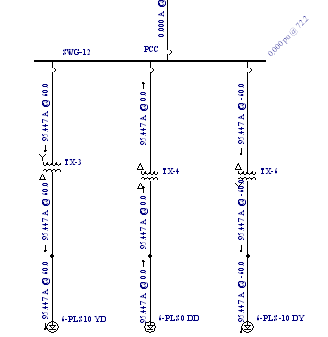
Figure 5: Fifth Harmonic Current Flow Based On All Source Injections
The motors under bus “SWG-12” represent an 18-pulse drive. Each motor injects a spectrum of harmonics. (The injected harmonic spectrum is specified in each Motor Data database dialog box. The EasyPower device library also contains typical harmonic spectra which can be imported.) The currents and voltages are based on all the fifth harmonic injections from the sources in the system. (This specified harmonic can be modified in the Harmonics Options dialog box.) Notice the fifth harmonic currents cancel on transformer “TX 12”due to phase cancellation. The All Source Current Flow feature determines flows in a network with all sources contributing.
 Harmonics Reports enables you to create harmonics text reports. When the report check boxes are selected,
tabulated text report information is created during each harmonics
Summation All or
Current Flow operation. These text reports can be opened after they have been created by selecting the appropriate report
from under the
Window button.
Harmonics Reports enables you to create harmonics text reports. When the report check boxes are selected,
tabulated text report information is created during each harmonics
Summation All or
Current Flow operation. These text reports can be opened after they have been created by selecting the appropriate report
from under the
Window button.
This has been a brief overview of EasyPower’s harmonics program. Features such as IEEE 519 verification, filter modeling, zero sequence and triplen harmonics calculations, multiple Y-axes for plots, harmonics bar charts, power flow link, and others are also available. The EasyPower User Guide and the Help system cover these harmonic features in greater depth.