 Harmonics Options. You can set the main control options, as well as options for text, one-line, and plot.
Harmonics options are set in  Harmonics Options. You can set the main control options, as well as options for text, one-line, and plot.
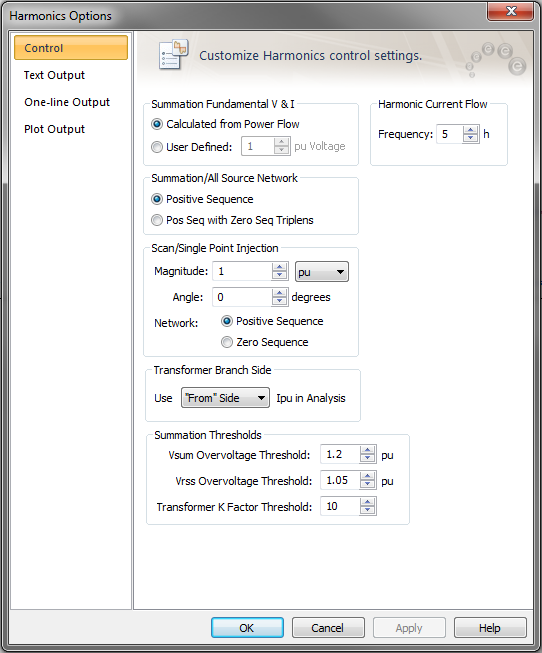
Select  Harmonics Options, and click the Control tab to specify various parameters for controlling the behavior of the harmonic analysis routines.

Figure 1: Control Tab of the Harmonics Options Dialog Box
Summation Fundamental V&I: Selecting Calculated from Power Flow causes the fundamental voltages and currents calculated in the Power Flow to be used for summation calculations. Selecting User Defined enables you to enter a per-unit fundamental voltage and causes the fundamental current to be determined by the Fundamental Amps setting in the Harmonics tab of the equipment dialog boxes.
Harmonic Current Flow: This field specifies the frequency for Single Point Current Flow or All Source Current Flow calculations.
Summation/All Source Network: All solutions will use positive sequence unless Pos Seq with Zero seq triplens is selected, in which case the solution for the 3, 6, 9, and so on harmonics use the zero sequence/network.
Scan/Single Point Injection: Magnitude is defined in either Amps or Per-unit. The Angle of the current being injected may also be entered. For Network, you can select to have the network solved based on the Positive Sequence or the Zero Sequence.
Transformer Branch Side: For items using a pi-model impedance representation (cable, transmission lines, and transformers), the branch side currents may differ. Select either the From or To, indicating which branch side to use for determining item losses, K-factor and derating. Frequency scans are also affected by this choice, where the current value plotted for a branch is selected here.
Summation Thresholds: VSUM, VRSS, and K-Factor violations can be highlighted on the one-line using threshold values.
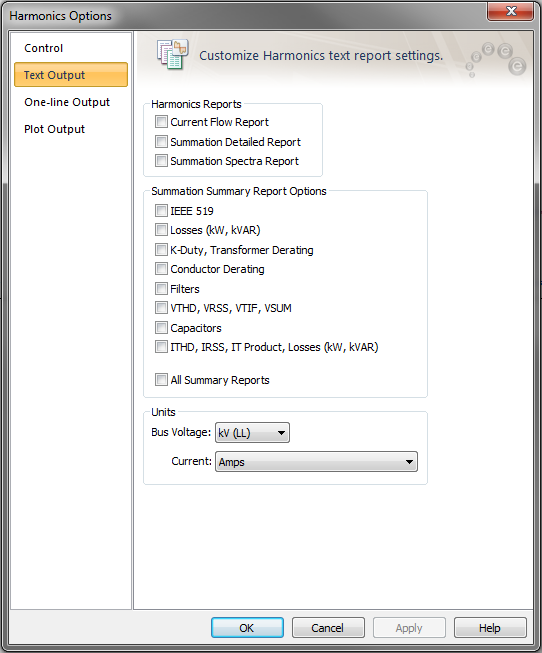
Select  Harmonics Options, and click the Text Output tab to select output report types. You can also click
  Harmonics Reports on the ribbon.

Figure 2: Text Output Tab of the Harmonics Options Dialog Box
Current Flow Report: Select Current Flow Report to generate a text report whenever a Single Point Current Flow or All Source Current Flow is performed. This report contains bus voltages and angles, as well as equipment currents and angles.
Summation Detail: The Summation Detailed Report contains a list of each bus and its attached equipment items along with the output analysis related to each item.
Summation Spectra: When Summation is selected, the Summation Spectra Report contains a list of buses with per-unit voltages and branch items with per-unit currents. All harmonics present are listed, while insignificant amounts are represented with a zero value.
To obtain a report of all harmonic sources, select the arrow below  Find in the ribbon and select
  Query. Select Items (Motor, Load, Motor Control Center, Panel Schedule), select Output > Item Selection, then in the Advanced tab for Load Class, select Any and for Load Type, select Harmonic.
Summation Summary: Select one or more of these reports, or select All Reports to have EasyPower create the complete report list.
Bus Voltage: The output can be displayed in either V(LL), kV(LL) or Per-unit.
Current Unit: Current can be displayed in Amps, Per-unit (system base), or Per-unit (equipment rating base).
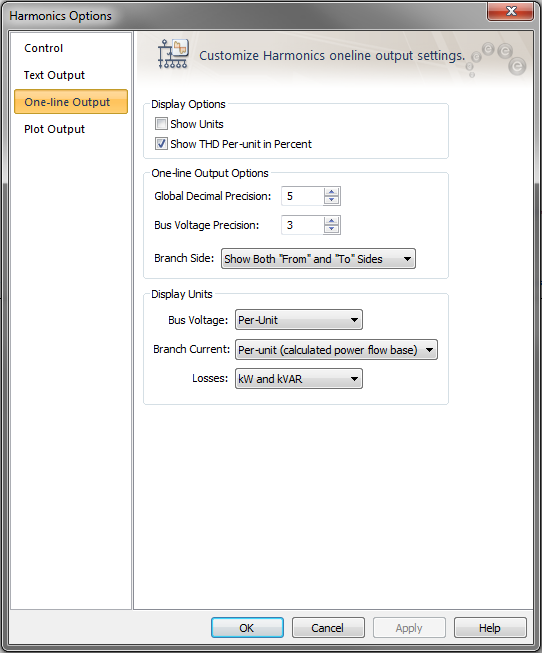
Select  Harmonics Options, and click the One-line Output tab to specify parameters that control how results are displayed on the one-line.

Figure 3: One-line Output Tab of the Harmonics Options Dialog Box
Show Units: Enabling this displays the units of the one-line results.
Show THD Per-unit in Percent: When this is enabled, the THD values are displayed in percent. Otherwise they are displayed in Per-Unit.
Global Decimal Precision: This sets the number of digits past the decimal point for values displayed on the one-line. This is applicable for all values except voltages.
Bus Voltage Precision: This sets the number of digits past the decimal point for bus voltages displayed on the one-line.
Branch Side: Display branch flows which are "From" the bus, "To" the bus, or both "From" and "To" the bus.
Bus Voltage: The output can be displayed in either V(LL), kV(LL) or Per-unit.
Current Unit: Current can be displayed in Amps, Per-unit (system base), or Per-unit (equipment rating base).
Losses Unit: Select either kW and kVAR or MW and MVAR.
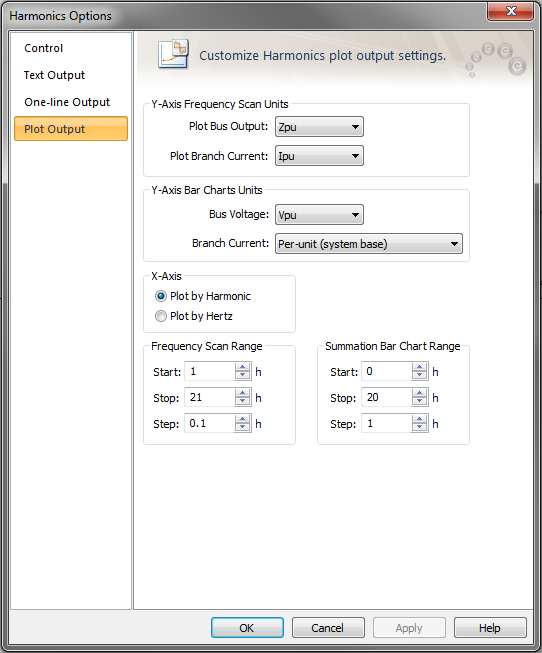
Select  Harmonics Options, and click the Plot Output tab to control the Frequency Scan plots and the Summation Bar Chart plots.

Figure 4: Harmonics Options Plot Output Dialog Box
Plot Bus Output: Specify the unit for frequency scan Y-axis. The choices are kV(LL), Vpu, Ohms, Zpu, Rpu, Xpu, and Angle (Deg).
Plot Branch Current: Specify the unit for frequency scan Y-axis for branches such as cables and transformers. The choices are Ipu and Amps.
Bus Voltage: Specify the unit for Summation Bar Chart Y-axis. The choices are Vpu, V(LL) and kV(LL).
Branch Current: Specify the unit for frequency scan Y-axis for branches such as cables and transformers. The choices are Amps, Per-unit (system base) and Per-unit (Equipment rating base).
X-Axis: Set the x-axis units to either frequency in hertz or harmonic multiple.
Frequency Scan Range: These fields control the Start and Stop points and the Step size for frequency scans. Be aware that a data point will be generated and output for each step. Since the plot output is limited to 5000 data points per curve, selecting a very small step size may limit the scan range.
Summation Bar Chart Range: When plots are defined, selecting Summation opens the plot viewer and displays bar charts. These fields specify the bar chart range.
| Harmonics with Spectrum™ | Tutorial - Harmonics Analysis |
| Harmonic Load Data | |
| DC Effects in Harmonics |

|