 Summation. Only the results for the sections selected are displayed.
 Summation analysis performs a system solution using injected harmonic currents from each harmonic source defined. Results are accumulated over all available injection frequencies and presented on the one-line and in text reports.
Most of the remaining buttons control which results of summation are displayed on the one-line.
Summation. Only the results for the sections selected are displayed. These results are stored so viewing is as fast as clicking different buttons. To solve for summations of all harmonic contributions, click Summation without selecting any item on the one-line.
The different summary report options are available by selecting the Text Output tab of the Harmonic Options dialog box.
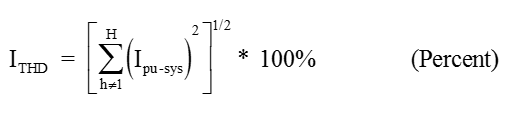
Branch currents results consist of  ITHD,
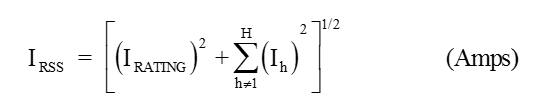
ITHD,  IRSS, and
  IT Product. The calculations are:

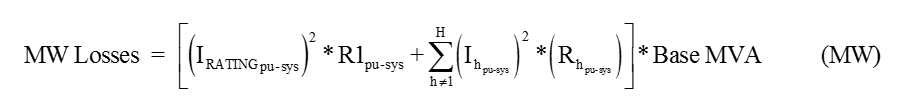
Losses and derating of branch equipment consists of  Losses,
 ![]() Transformer Derating via ANSI/IEEE C57.110-1986,
Transformer Derating via ANSI/IEEE C57.110-1986,  K Factor, and
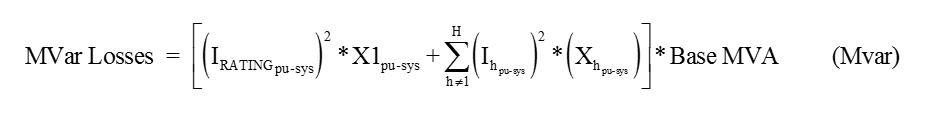
  Conductor Derating. The results are displayed at the center of a branch item. The calculations for these figures of merit are:
![]()
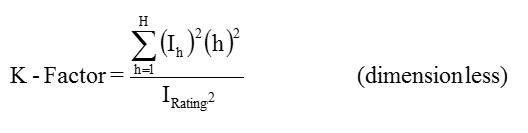
The K-factor equation is based on UL 1561, and differs slightly from the IEEE 519 K-Factor which in turn is based off of ANSI C57.110. In the K-Factor equation above, the value IRating is the transformer name plate rating and Ih is the current magnitude for each harmonic.
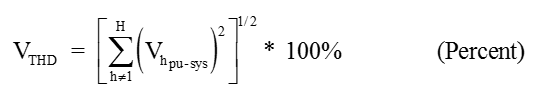
Voltage results are displayed at the right end of a bus and consist of  VTHD,
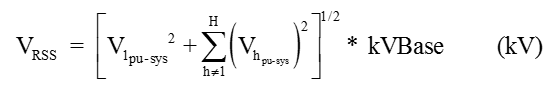
VTHD,  VRSS,
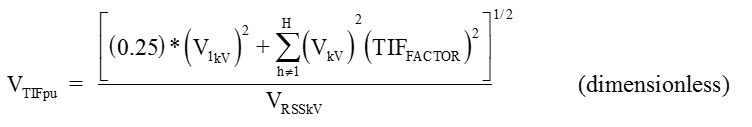
VRSS,  Telephone Interference Factor, and
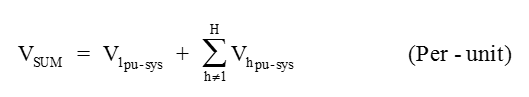
  VSUM. These are calculated using:
When Harmonics Options > Control is set to calculate based on Positive Sequence, the voltage THD values displayed are positive sequence values. When the option is set to calculate based on Positive Sequence with Zero Seq. Triplens, the voltage THD values displayed are zero sequence values.
The phase voltage for systems with harmonics zero sequence currents can be calculated from the sequence voltages:
Vph = (V1 + V2 +V0) / 3
Once you have defined plots, the plot viewer opens displaying bar charts whenever you click  Bar Chart. The bars show the per-unit voltage for defined buses and per-unit current for defined branch items at the respective harmonics.
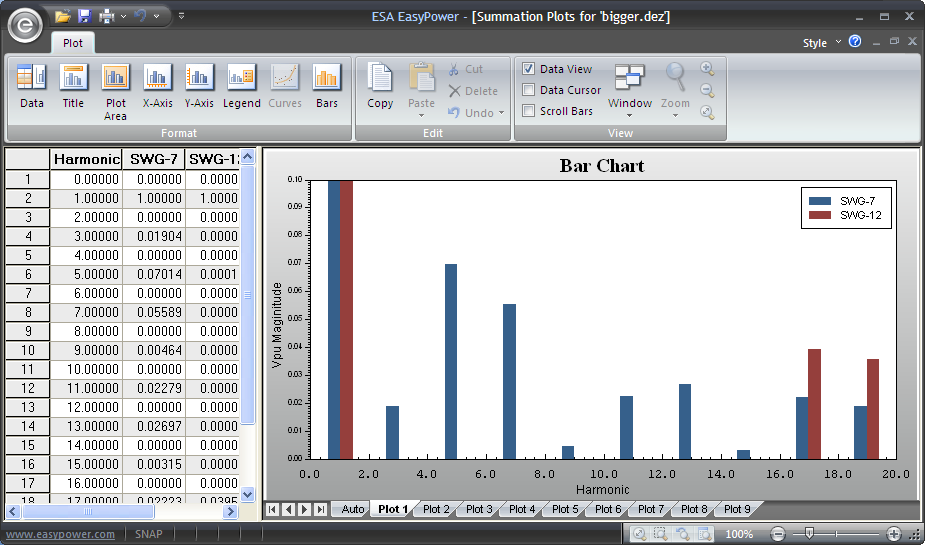
Figure 1: Plot Viewer Showing Bar Chart
 Harmonics Options and click the Plot Output tab. In the Summation Bar Chart Range section enter the range and step size of frequencies to be analyzed.
  Define Plots to add or remove items to be plotted. Bar Chart. EasyPower displays the bar charts.
| Harmonics with Spectrum™ | |
| Tutorial - Harmonics Analysis |
|
|