The Session Window
The EasyPower session window displays the EasyPower program options. The inner area of the window displays additional windows such as the Start Page, one-lines, or the device library. You can have one or multiple windows open in the inner area. Click the  Maximize button on the upper-right corner of the session window to make the window fill your screen.
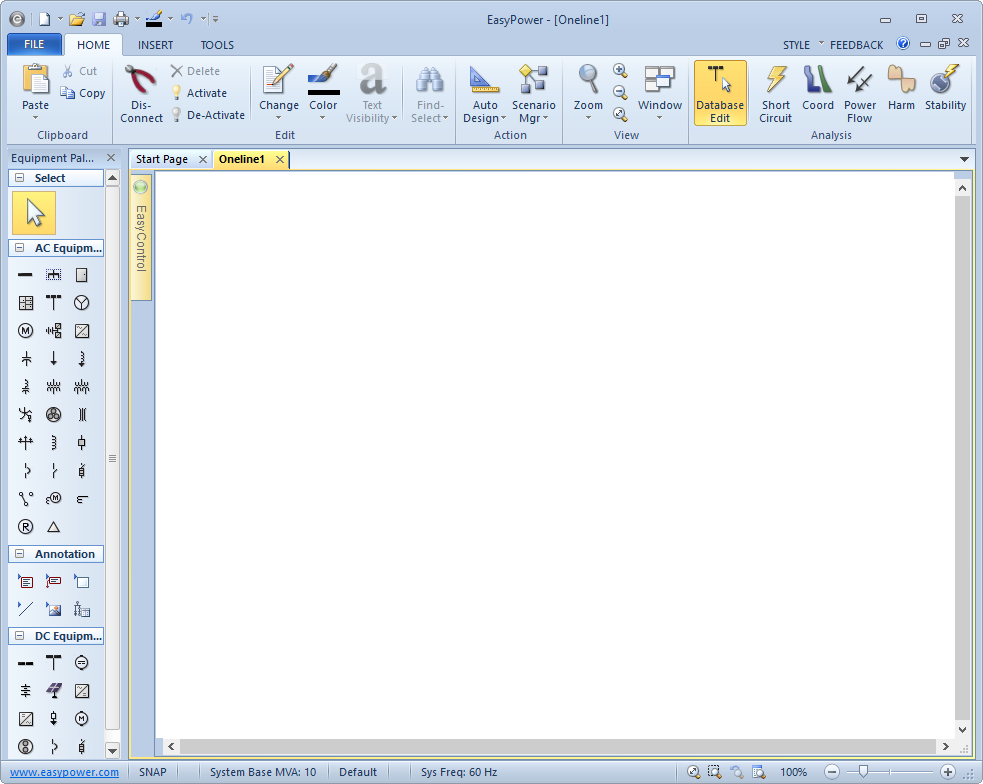
Figure 1: The EasyPower Session Window
The session window elements are described in the topics that follow.
Ribbons
Ribbons let you tell EasyPower what you want to do next. The ribbon area has one or more tabs where commonly used options are shown as buttons within groups. In the example shown below, the ribbon displays tabs for File, Home, Insert, and Tools. The Home tab includes button groups for Clipboard, Edit, Action, View, and Analysis.
Buttons that have actions that can't be performed at a given time are dimmed. Some buttons have a down-arrow symbol ![]() indicating additional options are available. Your ribbon may look different from the one below, depending on the product features your company purchased.
indicating additional options are available. Your ribbon may look different from the one below, depending on the product features your company purchased.
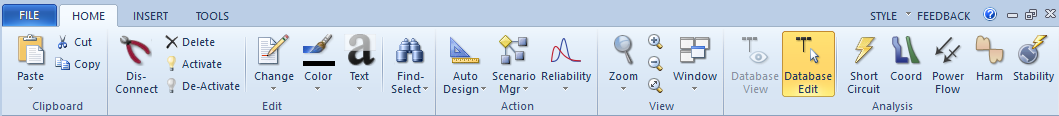
Figure 2: EasyPower Ribbon
Ribbons were introduced in EasyPower 9.0 and provide a more efficient way to work with EasyPower. Previous versions supported a menu bar and toolbars.
You can change the appearance of the ribbon by choosing Style from the upper right area of the window.
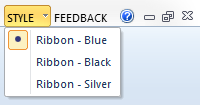
Figure 3: Change Style
Quick Access Toolbar

Figure 4: Quick Access Toolbar
The Quick Access Toolbar is located at the top left area of the EasyPower window when the style is set to display the ribbon. By default this toolbar has the commands New (create a new one-line), Open, Save, Print and Undo.
Click  Customize Quick Start Toolbar to add or remove items from the toolbar.
Context Menus
You can click right-click anywhere on the screen to display an additional context-sensitive menu. The menu changes based on where you are working in the software. Only options that are appropriate for that area are displayed. Some options may be appropriate for the area but are dimmed until a specific action is taken (for example, only after selecting an item onscreen).
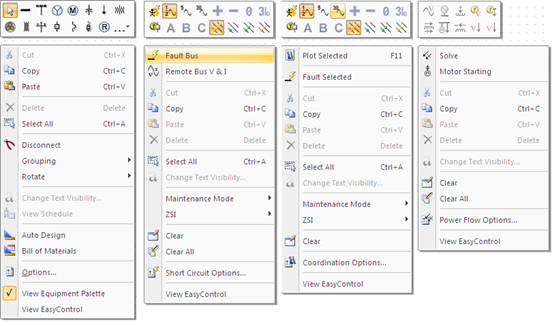
Figure 5: Context Menu Examples
Status Bar
There is an optional Status bar at the bottom of the session window that provides information about settings you have chosen. The information displayed varies slightly depending on the current focus you are in. The Database Edit status bar is shown here.

Figure 6: Status Bar
| Option | Description |
|---|---|
|
Displays SNAP if grid snapping is on. See The Snap Grid for more information. |
|
|
Clipboard |
The last item copied to the clipboard is displayed here. If you click Paste, that item will be pasted on the one-line. |
|
System Base |
The system base MVA as selected in Tools > Options > System. |
|
Equipment Default |
The name of the database used for equipment default settings. The database can be specified in Tools > Options > File Locations. |
|
System Frequency |
The system frequency as selected in Tools > Options > System. |
|
View/Zoom Controls |
Several zoom options are available:
You can also use the slider to change the zoom levels. Tip: If your mouse is equipped with a wheel button, you can also use it to zoom in and out. |
You can right-click on the status bar to select different information to display.
Equipment Palette
The Equipment Palette enables you to add AC or DC equipment and annotation to the one-line. While you are editing the database, the equipment palette provides the necessary equipment types to create a power system one-line diagram.
The symbols that appear are based on the symbol option that is selected in Tools > Options > One-line Symbols. If you change the symbol option, you must close and reopen EasyPower to display the selected template symbols.
Note: Custom symbols do not appear here. Only ANSI or IEC symbols are displayed.
Tip: You can also insert items through the Insert tab.
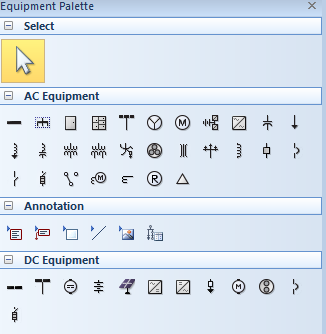
Figure 7: The Equipment Palette (ANSI Symbols)
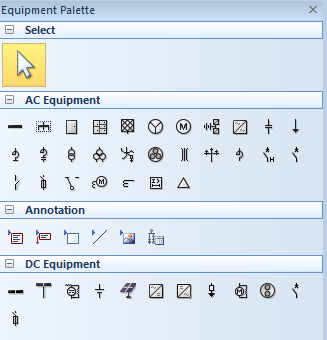
Figure 8: The Equipment Palette (IEC Symbols)
Tip: You can right-click on the palette and switch between a List View or an Icon View. You can also hover over the icons while in Icon View to see a description of the equipment symbol.
You can hide or show the equipment palette by right-clicking in the one-line area and selecting the desired option from the context menu.
For more information about what each symbol represents, see Equipment Palette Symbols.
EasyControl Toolbox
The EasyControl toolbox provides easy access to your drawings and named views. By default, it appears as a tab next to the Equipment Palette. When you hover over the EasyControl tab, the toolbox appears.
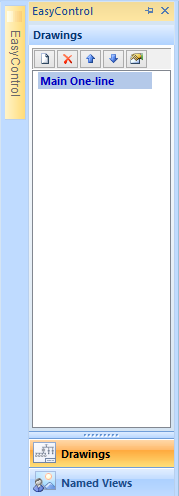
Figure 9: EasyControl Toolbox
For more information, see Drawings and Named Views.
You can hide or show the EasyControl tab by right-clicking in the one-line area and selecting the desired option from the context menu.
Open a One-line
From within the session window, there are two ways to open a one-line:
- If the Start Page is open, click New.
- If the Start Page is closed, click File > New > New One-line.
Click
 Maximize on the one-line window, if needed, to fill the session window with the one-line.
Open a new one-line using one of the methods listed above.