Plotting Results
Even though EasyPower opens the plot viewer automatically, there are many aspects of the plot window that you can control.
Viewing Plots
The Plot Window has scroll bars which function as described in Moving Around on the One-line. The zoom buttons are also available for viewing plots, and they work as discussed in Zooming In and Out.
To view any of the ten different plots, click the tab for that plot. The default is to show only a few of the tabs. Click the arrow keys to the left of the tabs to scroll through the other tabs.
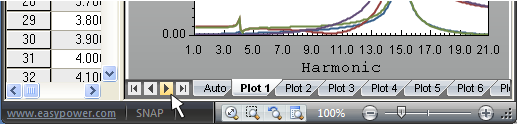
Figure 1: Scrolling Through Plot Tabs
To view a separate Y-axis for each curve, click  Y-Axis (Format Y Axis). On the Appearance tab, select the Multiple Y-Axis check box.
To toggle whether data is viewed or just the plot, on the Plot tab, select the Data View check box. To view more of the data window, use the vertical splitter window pointer to drag the window boundary one way or the other. Change column widths by using the column resizing pointer or by using the Format Plot Data dialog box.
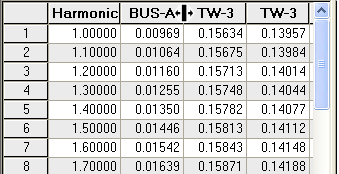
Figure 2: Changing Column Boundaries
Selecting data is performed by using the same method as the device library. Selected data can be copied to the clipboard and then pasted into other applications.
Formatting Plots
The Format group in the Plot tab has several buttons for formatting the plot. Each command (Data, Title, Plot Area, X Axis, Y Axis, Legend, and Curves) opens a different dialog box for customizing that respective area.
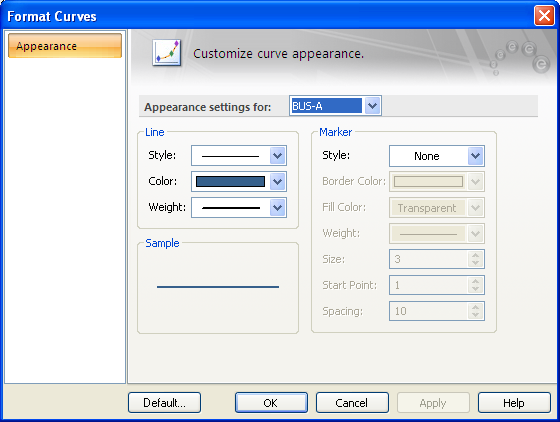
Figure 3: Format Curves Dialog Box
These dialog boxes can also be opened by double-clicking on the area to be formatted. For example, double-clicking on any of the curves opens the Format Curves dialog box, and enables formatting of one or all of the curves.
Right-click in either the plot or data area to bring up a context menu for that area containing the Format and View commands.
To change the default settings, open the appropriate format dialog box and change the desired parameters. Then click the Default button in the lower-left corner. Any changes made will be reflected in all new plots.
Printing Plots and Data

Figure 4: Quick Access Toolbar
If the plot viewer is open, click  Print on the Quick Access Toolbar to open the Print Plot dialog box.
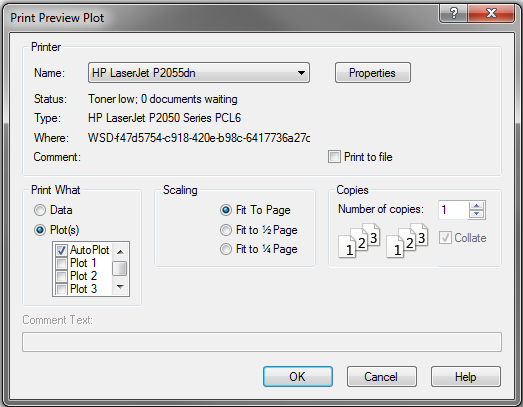
Figure 5: Print Plot Dialog Box
The Print Plot dialog box is similar to the others discussed in Printing and Plotting. However, the options under Print What control whether to print Data or Plots. EasyPower gives the option of printing multiple plots at the same time.
When Data is selected, the Scaling field is unavailable. If Plots is selected, Scaling remains available, and the plot size (full, ½, or ¼) is determined by the scaling options.
More Information
| Harmonics with Spectrum™ | |
| Tutorial - Harmonics Analysis |