Tutorial - Reliability
This tutorial describes how you can use the Reliability feature in EasyPower. Reliability gives you the tools to quantify the reliability, availability, and cost impact of downtime for your electrical power system networks.
Open the Reliability Sample Database
EasyPower includes several sample files that correspond to the examples in the IEEE 493-2007 "Gold Book" examples. You can find the files in C:\Users\{username}\Documents\EasyPower 10.3\Onelines\Samples\Reliability.
For this example, open Reliability IEEE493 Example 1_page37.dez.
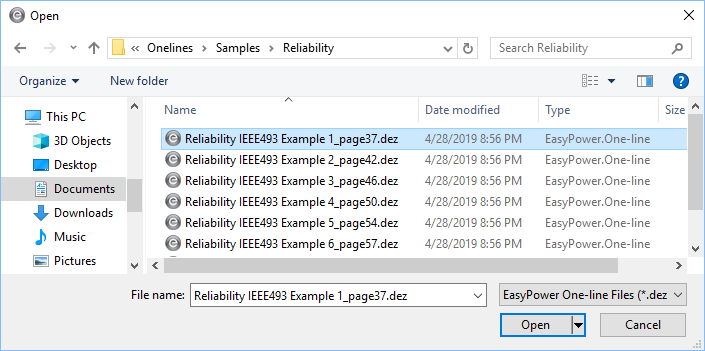
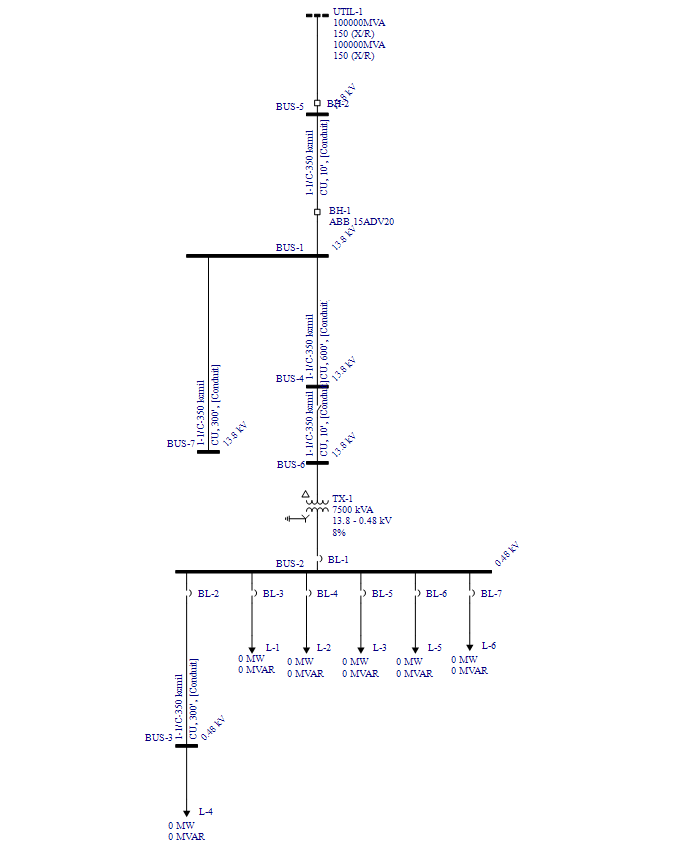
This sample replicates the Example 1 in the Gold Book, which is a simple radial system with a single source.
Import the Reliability Data
The EasyPower installation comes with a reliability library that includes data from IEEE 493-2007 Annex Q. You can import this data into your one-line to easily populate your equipment and devices with reliability data.
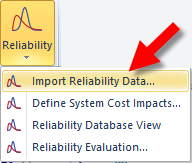
To import the reliability library data:
- Under the Reliability button, click Import Reliability Data.
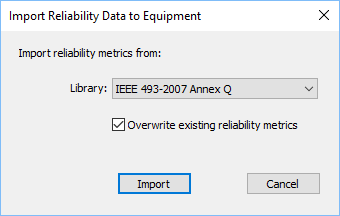
- In the Import Reliability Data to Equipment dialog box, you can select the library from which you want to import reliability data (including a custom library if you have one). You also have the option to overwrite any existing reliability information. Ensure that IEEE 493-2007 Annex Q is selected. For this tutorial, select the Overwrite existing reliability metrics check box, and then click Import.
- The program displays a message indicating how many records were updated. Click OK.
Viewing and Editing the Reliability Data
There are two places you can view and edit the data. The first is in the individual data dialog boxes. For example, if you open the data dialog box for breaker BH-1 and click the Reliability tab, you can see the reliability data for the breaker.
Tip: You can also click Import in the data dialog boxes to import data to individual equipment items.
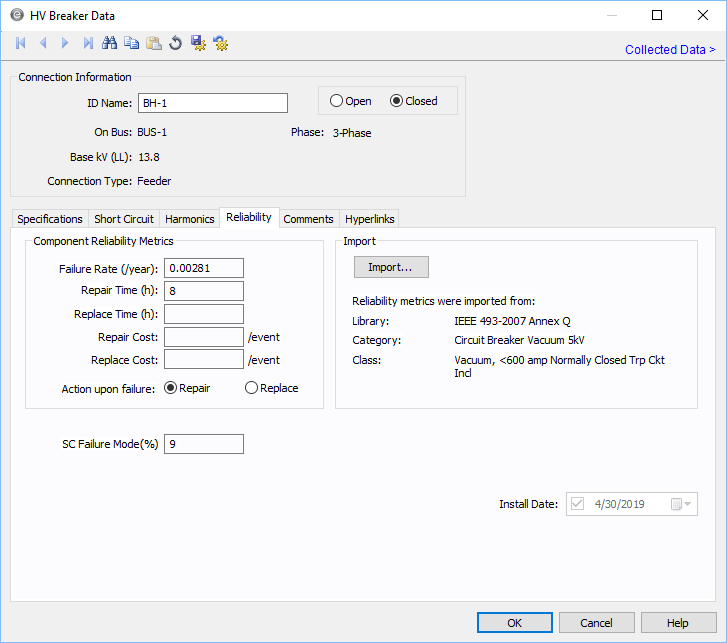
You can manually input data for the item, or import the data. You can also select whether the primary action to take upon failure is to repair or replace the item. You can input the cost for the repair or replacement.
Reliability Database View
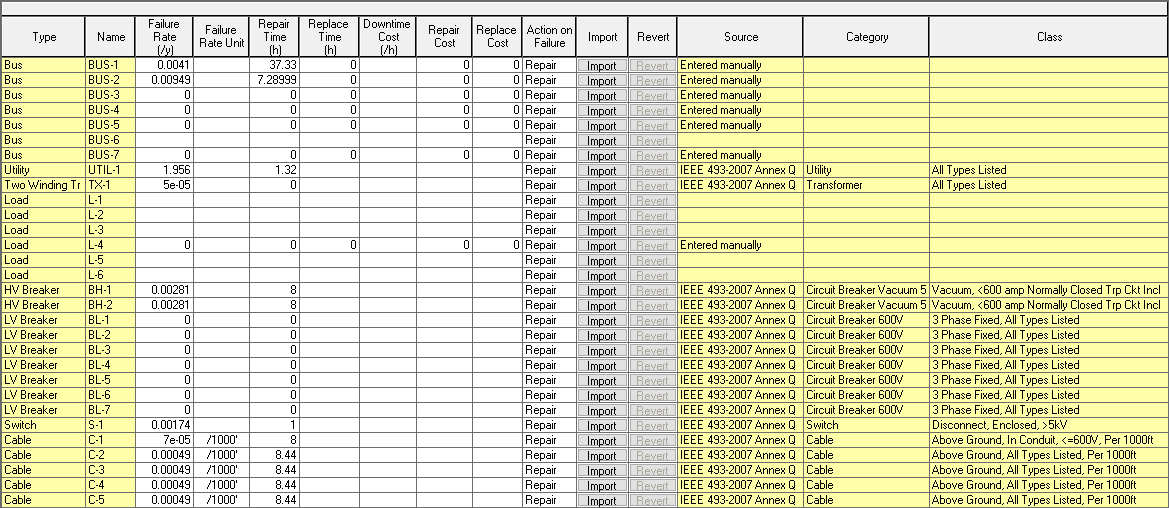
The other method where you can see and edit the data is in the Reliability Database View.
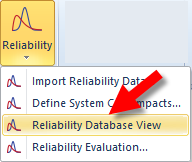
- Under the Reliability button, click Reliability Database View.
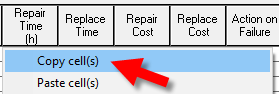
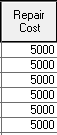
- You can perform bulk edits in the Reliability Database View. For example, let's assume that the average repair cost for each item is $5,000. (Obviously, this is not a realistic example, but the method you will use to edit will be the same.) For the first bus, in the Repair Cost cell, type 5,000. Move off of the cell to save your number, and then right-click on the cell and click Copy cell(s).
- Select the remaining cells in the Repair Cost column, and then press CTRL+V to paste the first cell value to all the remaining cells.
- Close the Reliability Database View.
 :
:
Note that the changes you make are saved immediately and automatically.
Defining System Cost Impacts
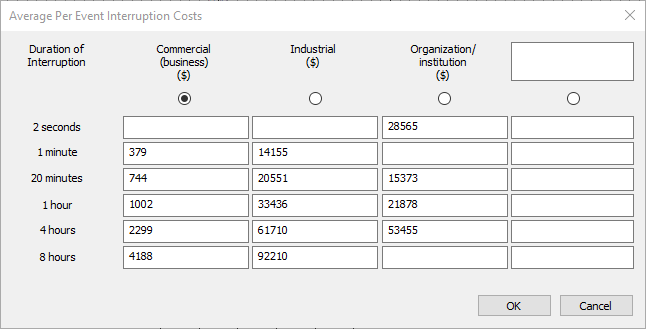
EasyPower includes a table for determining the average interruption cost for each event. This table replicates information found in the IEEE 493-2007 standard in Table 3-18. You can select the business type that most closely matches your situation or you can use the column on the far right to input your own numbers.
To open the table, click Reliability > Define System Cost Impacts.
Performing a Reliability Evaluation
After you have imported the library data or manually input the reliability information, you can perform a reliability evaluation. To perform the evaluation:
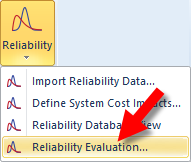
- Under the Reliability button, click Reliability Evaluation.
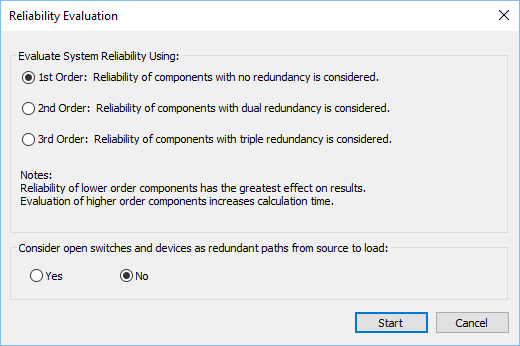
- You are asked to select from a 1st, 2nd, or 3rd order redundancy. For this system, we will select 1st order, and then click Start.
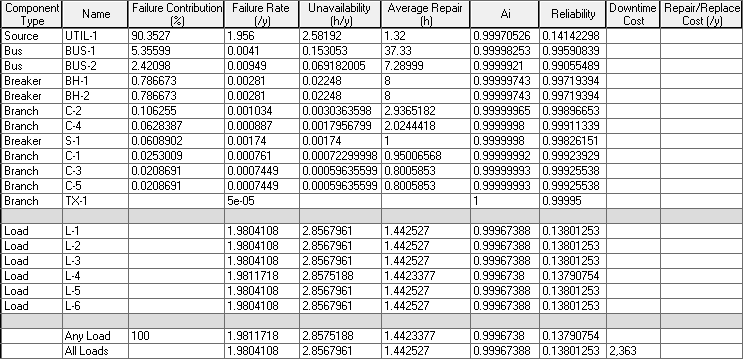
- The program displays the results of the evaluation. Individual components are listed along with branch and load information. The rows at the bottom of the report displays results for any or all loads.
Pareto Charts
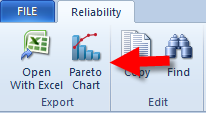
You can display Pareto charts on your reliability evaluation results. There are several charts available. To view a Pareto chart, after running a reliability evaluation, click Pareto Chart.
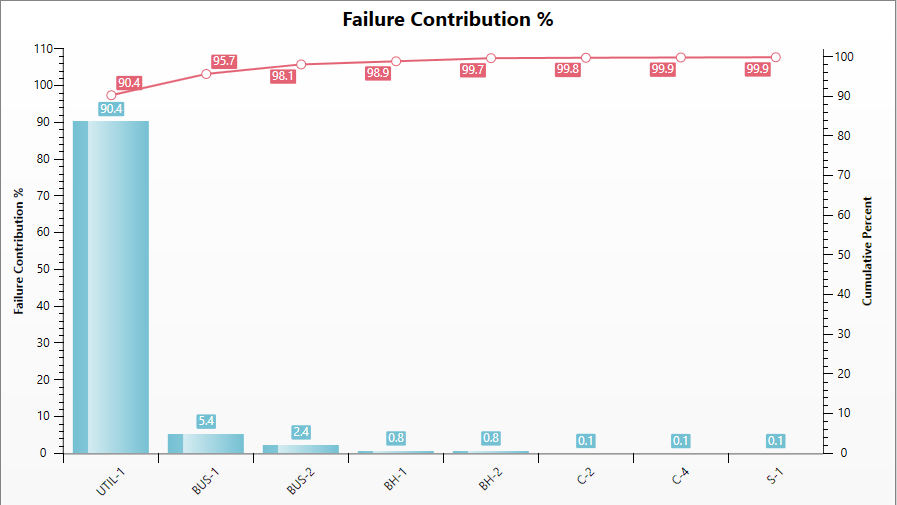
The program displays one of several available reports. Select Failure Contribution % from the list. The Failure Contribution % report shows that when you take all potential circumstances under consideration, the equipment that has the highest percentage of contribution to failure is the utility. The next item that most contributes to the failure percentage is BUS-1, and so on. The red line indicates the overall accumulated percentage, so UTIL-1 is 90.4% of the total, UTIL-1 with BUS-1 is 95.7% of the total, and so on.
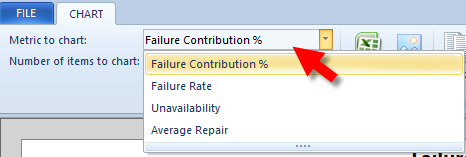
You can select from a list of different Pareto charts that display results for failure contribution %, failure rate, unavailability, and average repair time.
Conclusion
This has been a brief overview of EasyPower’s Reliability feature. The EasyPower Help topics cover this and other features in greater
depth. To open Help, click  Help in the upper-right corner of the EasyPower window or press F1.
More Information
| EasyPower® Tutorials |