Plot Output Tab
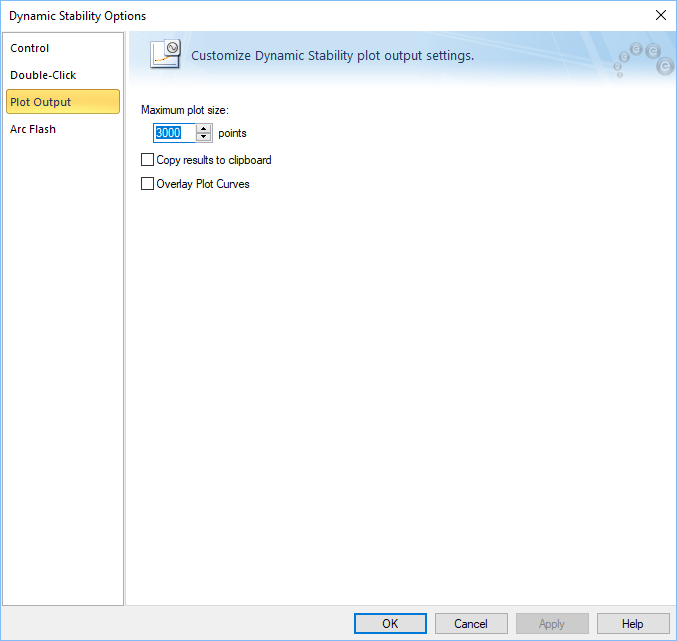
Figure 1: Dynamic Stability Options - Plot Output
| Option | Description |
|---|---|
|
Maximum plot size |
This is the number of data points at various time intervals stored for each variable during a simulation run. |
|
Copy results to clipboard |
When a simulation is run, the data is copied to the clipboard if this check box is selected. You can paste the data to a spreadsheet. |
|
Overlay Plot Curves |
With this check box selected, the plot of various variables overlay each other. If the check box is not selected, the plots are separated and the vertical axes are scaled automatically. |