Formatting Plots
When you select the DS Plot window, EasyPower displays a Plot tab. You can format the dynamic stability plots with the commands in the tab.
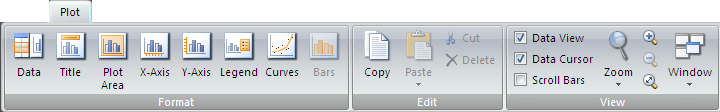
Figure 1: Plot Tab
Note: If you have purchased only the Transient Motor Starting module and not the Dynamic Stability module, your menus and options will reflect the names "Transient Motor Starting" or "TMS" instead of Dynamic Stability.
To view the data in the plot at the pointer position, select the Data Cursor check box on the Plot tab. The top right corner for legend will show the coordinates of the pointer.
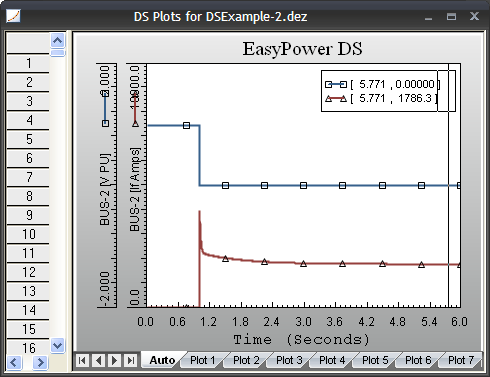
Figure 2: Data Cursor
To format the plot, right-click on the plot area and select desired command from the context menu, or select the option from the Plot tab. The following format options are available.
- Format Title
- Format Plot Area
- Format X Axis
- Format Y Axis
- Format Legend
Defaults
The formatting changes can be stored as defaults so that new plots are automatically created using the default format. In the individual format dialog boxes, make your changes and then click Default to set the new default value.
Format Title
You can also double-click on the plot title to access the Format Title dialog box.
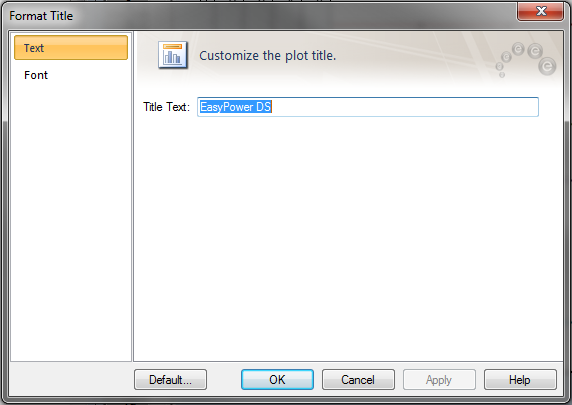
Figure 3: Format Title Dialog Box
| Option | Description |
|---|---|
|
Title Text |
This field is for changing the name of the plot title. |
|
Font |
The font format can be changed through the Font tab. |
Format Plot Area
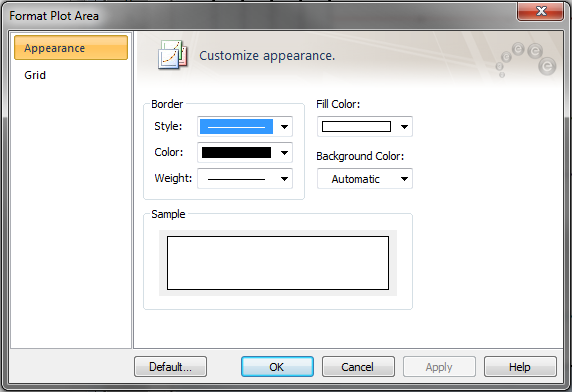
Figure 4: Format Plot Area Dialog Box
You can format the plot area border, background, fill color and the gridlines.
Format X or Y Axis
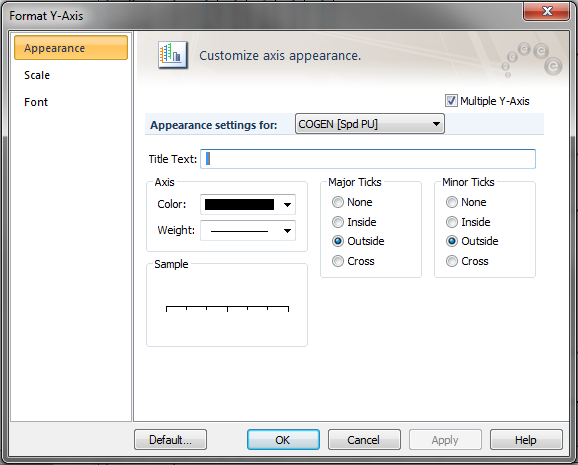
Figure 5: Format Y Axis Dialog Box
| Option | Description |
|---|---|
|
Multiple Axis |
For multiple variables in a plot, selecting this check box plots multiple Y axes. Each Y axis can have its own scale. |
|
Current Axis |
You can select the desired Y axis though this box to format the axis. |
|
Appearance |
Format the axis title, color, weight and ticks. |
|
Scale |
You can select the minimum and maximum values for the axis, the tick marks, and the decimal precision for values on the axis. |
|
Font |
You can select the font type, style, color, size, and the background for the text on the axes. |
Format Legend
You can format the box and the text of the legend.