Example 1: Sample DC System
In this example, we will:
- View how the AC and the DC equipment are connected in the one-line.
- Browse through the equipment dialog boxes to view the data. Many of these are similar to the AC equipment dialog boxes, with some minor differences.
- Run various types of analysis, including power flow, coordination, short circuit and arc flash hazard.
To view the sample and perform each analysis, open the example file DC Bus Example-1.dez located in your Samples directory.
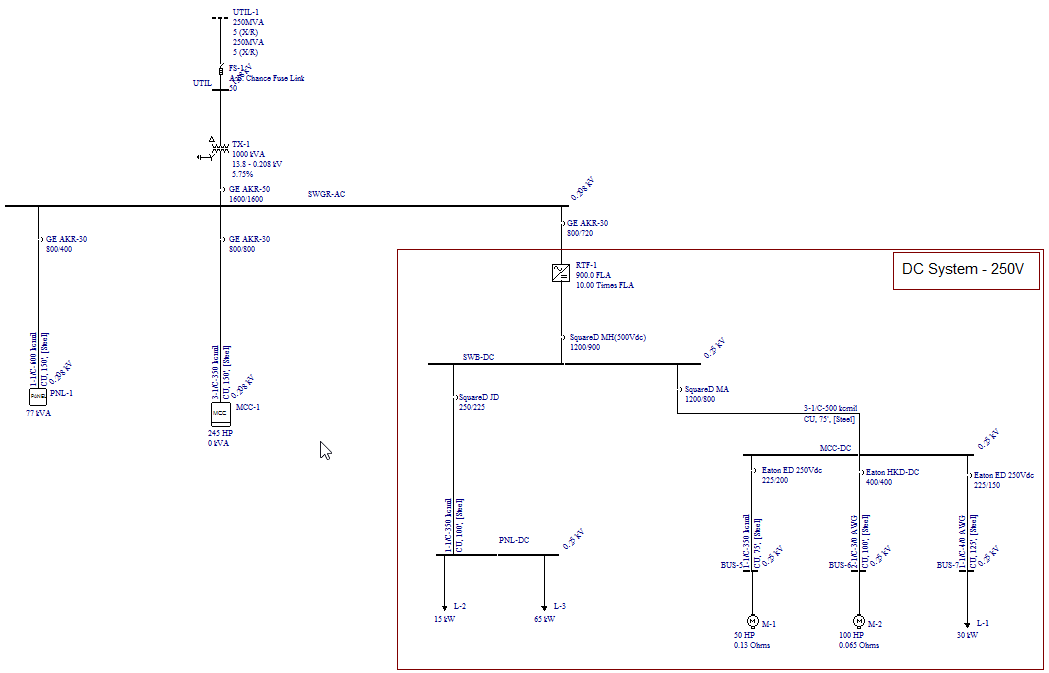
Figure 1: DC Bus Example-1
This one-line has both AC and DC equipment. Rectifier RTF-1 converts AC into DC and feeds 250V DC to switchboard SWB-DC. Other DC items modeled in this one-line are motors, loads, cables and circuit breakers.
Rectifier
Double-click on the RTF-1 rectifier symbol on the one-line to open the rectifier dialog box.
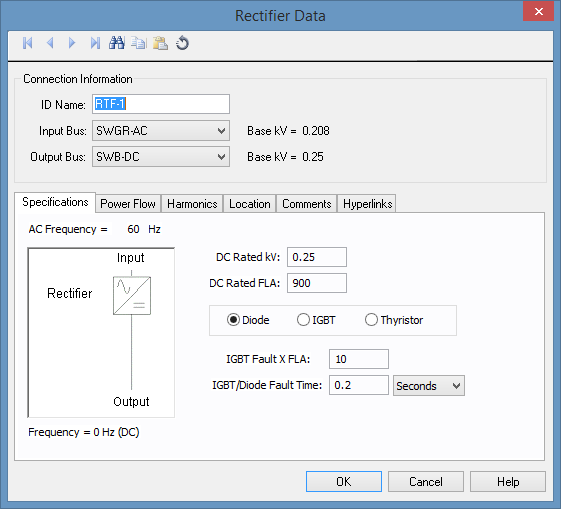
Figure 2: Rectifier Data Dialog Box - Specifications Tab
Relevant fields are described below.
| Option | Description |
|---|---|
| DC Rated kV | Rated output (DC) voltage is 0.25kV (or 250V). |
| DC Rated FLA | Rated output (DC) current is 900A. |
| Diode/IGBT/Thyristor | This is a diode rectifier, which does not have voltage control. Other choices are IGBT and Thyristor, both of which have voltage control. Diode rectifiers can have DC terminal fault current close to the AC side fault current. |
| IGBT Fault X FLA | This is the amount of fault current at the DC output terminal of rectifier in multiples of the DC Rated FLA. This rectifier can supply up to 10 times FLA, which is 9000A. |
| IGBT/Diode Fault Time | This is the maximum duration the rectifier can supply fault currents. This has a default value of 0.2 seconds. Some rectifiers have a control circuit that senses overcurrent and instantaneously turns off the output. |
The fields described above are adequate for short circuit and arc flash hazard analysis. However, you need to enter commutation impedance information in the Power Flow tab to perform power flow analysis.
Notice that there is no field for the rated input voltage or current.
- Rated input voltage is assumed to be equal to the AC side bus voltage.
- The rated input current can be calculated from the efficiency and power factor specified in the Power Flow tab.
Select the Power Flow tab.
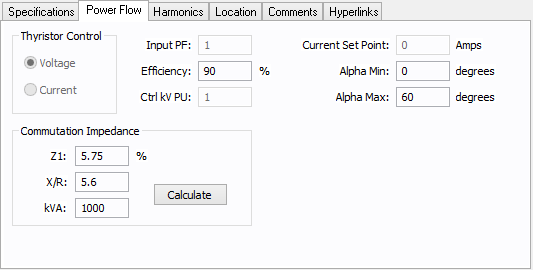
Figure 3: Rectifier Power Flow Tab
Relevant fields are described below.
| Option | Description |
|---|---|
| Commutation Impedance |
These values are used in Kimbark's equations to calculate power flow across the rectifier. This is an estimate of the line side impedance. If the rectifier has a dedicated transformer, then use that transformer data as a close approximation. If not, use the upstream transformer data. In this example, the upstream transformer is 1000kVA, with 5.75% impedance, and an X/R ratio of 5.6.
|
Other fields in the Power Flow tab are described in DC Power Flow Analysis.
Note: These fields in the Power Flow tab only affect the power flow solution and not the short circuit or arc flash analysis. Using estimates here does not affect short circuit calculations.
DC Bus
Double-click on the SWB-DC bus to open the dialog box. This is similar to an AC bus dialog box.
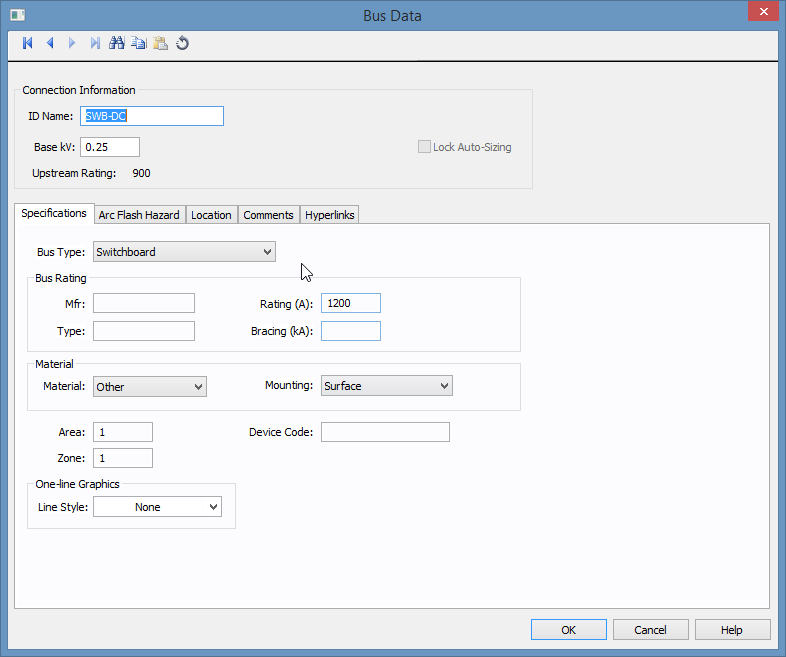
Figure 4: DC Bus Dialog Box
Relevant fields are described below.
| Option | Description |
|---|---|
| Base kV | This is the rated bus voltage. In this example, it is 0.25kV (or 250V). |
| Type | The type of bus. In this example, the bus type is switchboard. |
DC Cables
Double-click on the C-6 cable on the downstream left side of the SWG-DC bus to open the dialog box.
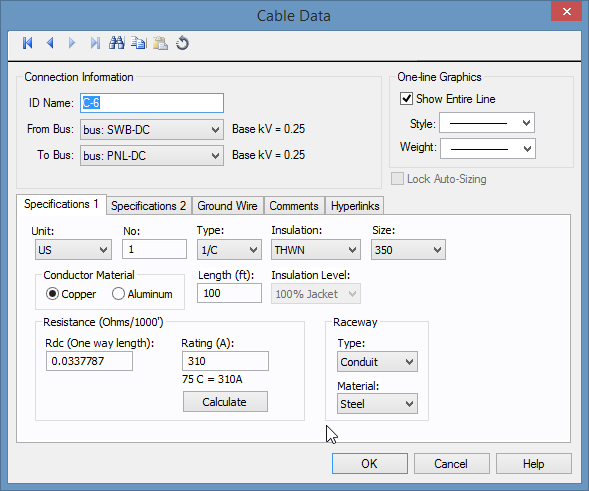
Figure 5: DC Cable Dialog Box
For the purpose of calculations, the most important fields are Resistance, Length, and Rating.
| Option | Description |
|---|---|
| Resistance (Ohms/1000') Rdc (One way length) | This is the DC resistance per 1000 feet of conductor, and can be calculated from the fields Type, Insulation, and Size. The total resistance is calculated from this value, the length of cable, and the number of cables in parallel. |
| Length | This value must be entered to calculate the total resistance. |
| Rating (A) | This value can be calculated from the selections made in Type, Insulation, Size, and No (number). |
DC Motors
Double-click on the M-1 motor symbol on the one-line to open the DC Motor Data dialog box.
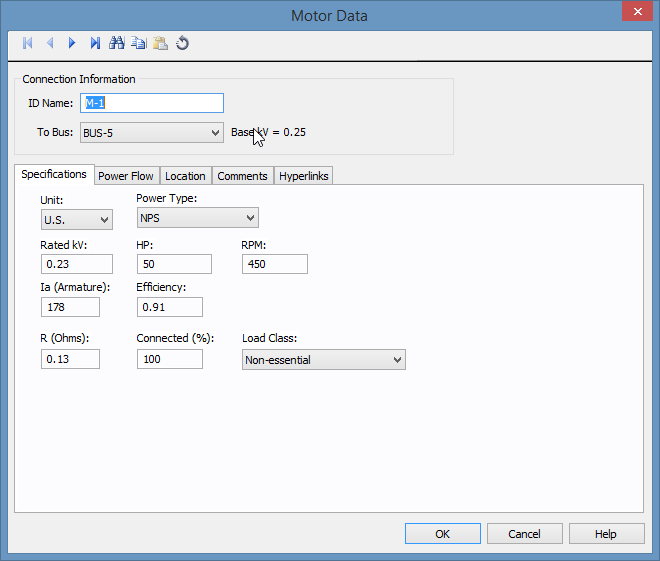
Figure 6: DC Motor Data Dialog Box
Relevant fields are described below.
| Option | Description |
|---|---|
| R (ohms) | This is the armature resistance including the resistance in the commutator. This is the most important data for short circuit calculations. |
| HP | Rated horsepower of the motor. This is used in power flow. |
| Efficiency | Efficiency at the rated conditions. The input kW is calculated as 0.746 * HP / Efficiency. |
Note: Rated kV, Ia (Armature), and RPM are name plate data and are only for reference.
DC Loads
Double-click on the L-1 load symbol on the one-line to open the Load Data dialog box.
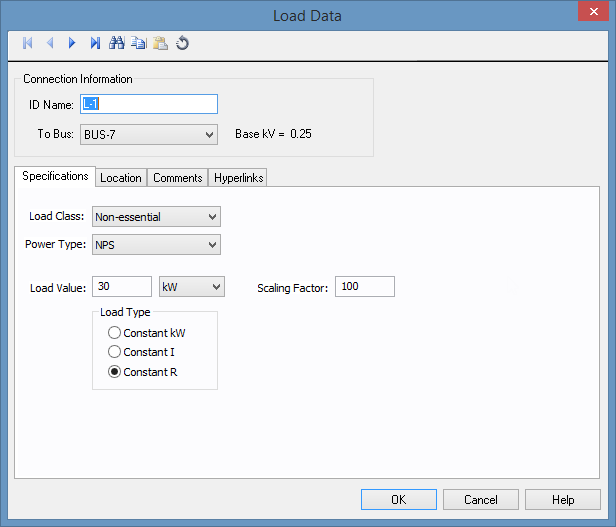
Figure 7: Load Data Dialog Box
Loads are not considered in short circuit analysis, but are used in power flow analysis.
DC Short Circuit Calculations
Close any open data dialog boxes and perform a short circuit analysis, as follows:
- Click
 Short Circuit to open the short circuit focus.
 - Click
 Momentary.
 - Click
 Fault Bus(es). This faults all the buses in the one-line
 - View both the AC and DC buses. Note that both AC and DC calculations are performed simultaneously.
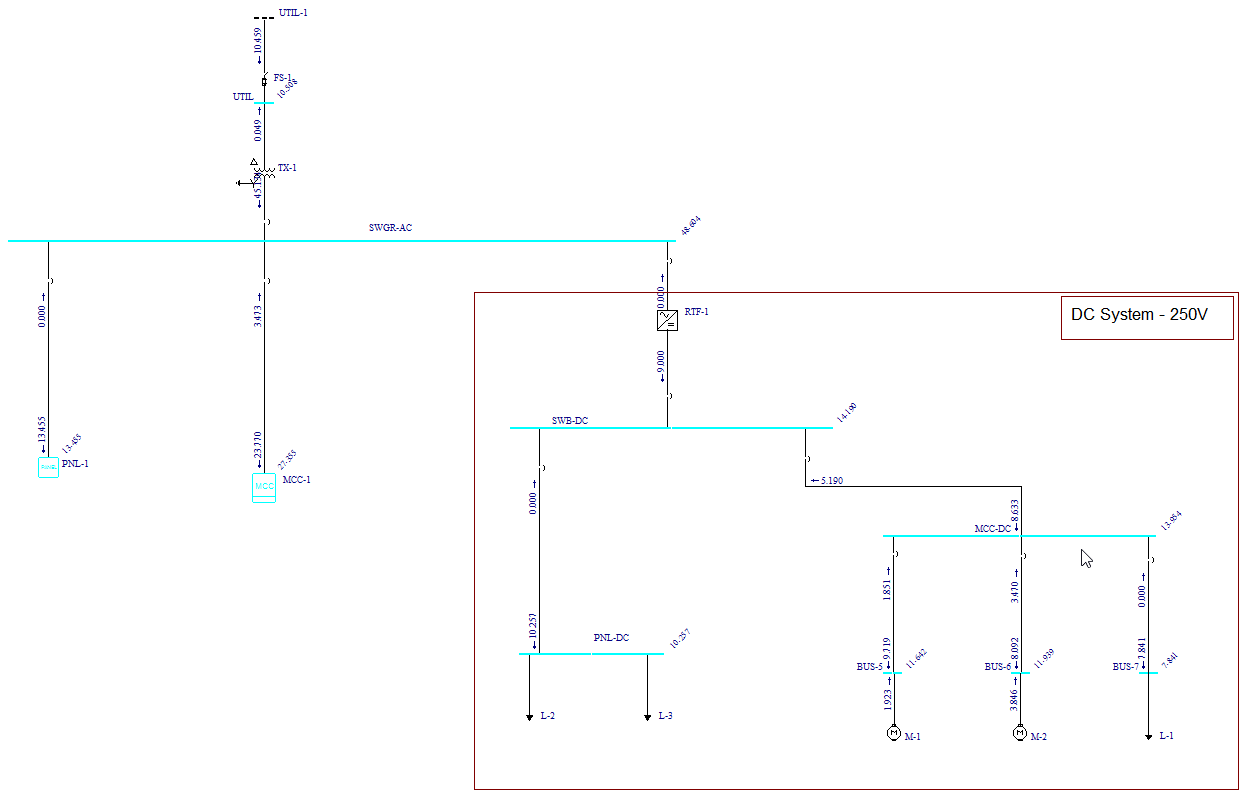
Figure 8: Short Circuit Results for DC Buses
DC Arc Flash Calculations
- Click
 Arc Flash to display the arc flash hazard results.
 - Press F8 to view the Arc Flash Hazard Report.
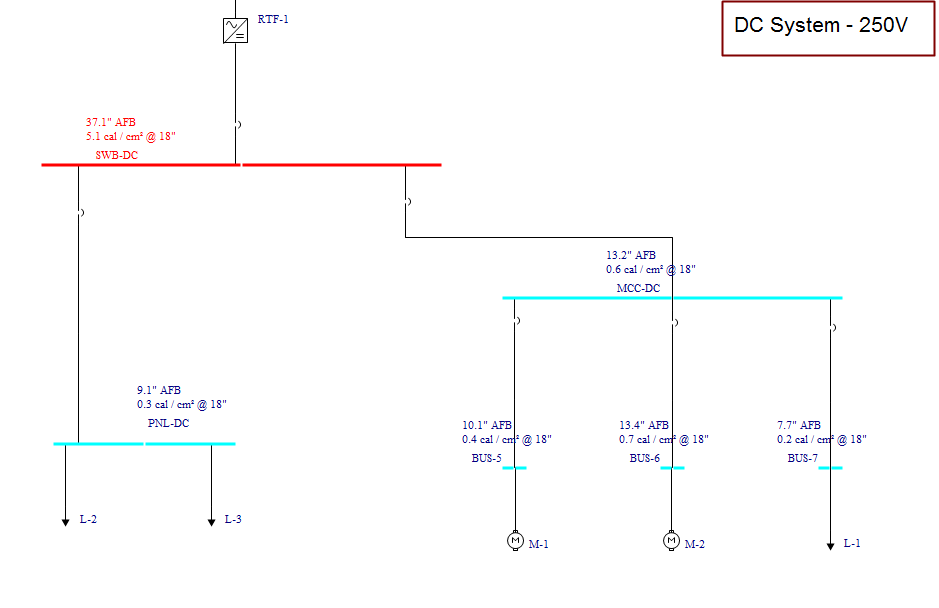
Figure 9: Arc Flash Hazard Results
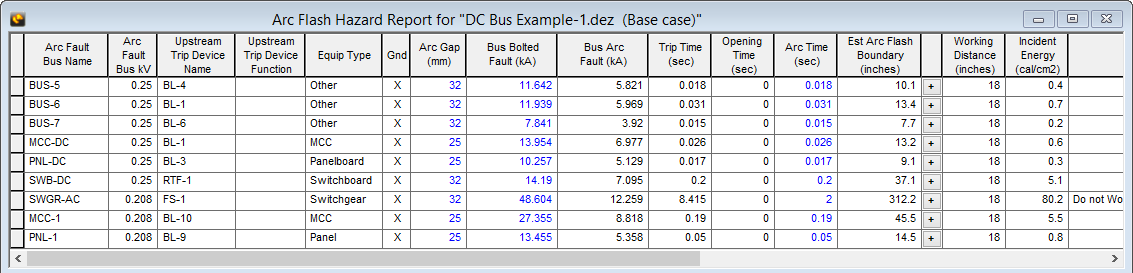
Figure 10: Arc Flash Hazard Report
DC Protective Device Coordination
- Select the one-line window, and then click
 Coordination to open the coordination focus.
 - Click Open TCC, select SWB-DC bus, and then click Open. The TCC plot for the three breakers at the DC switchboard are displayed.
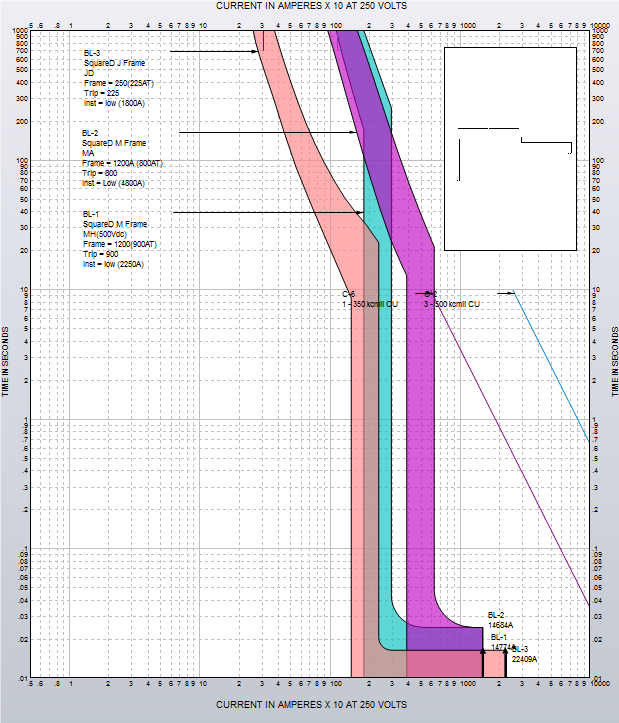
Figure 11: TCC Plot for DC Breakers
DC Power Flow Analysis
- If you are still viewing the TCC plot from the previous analysis, close the window to return to the DC Bus Example-1.dez one-line.
- Click
 Power Flow.
 - Click
 Solve to display the power flow results on the one-line.
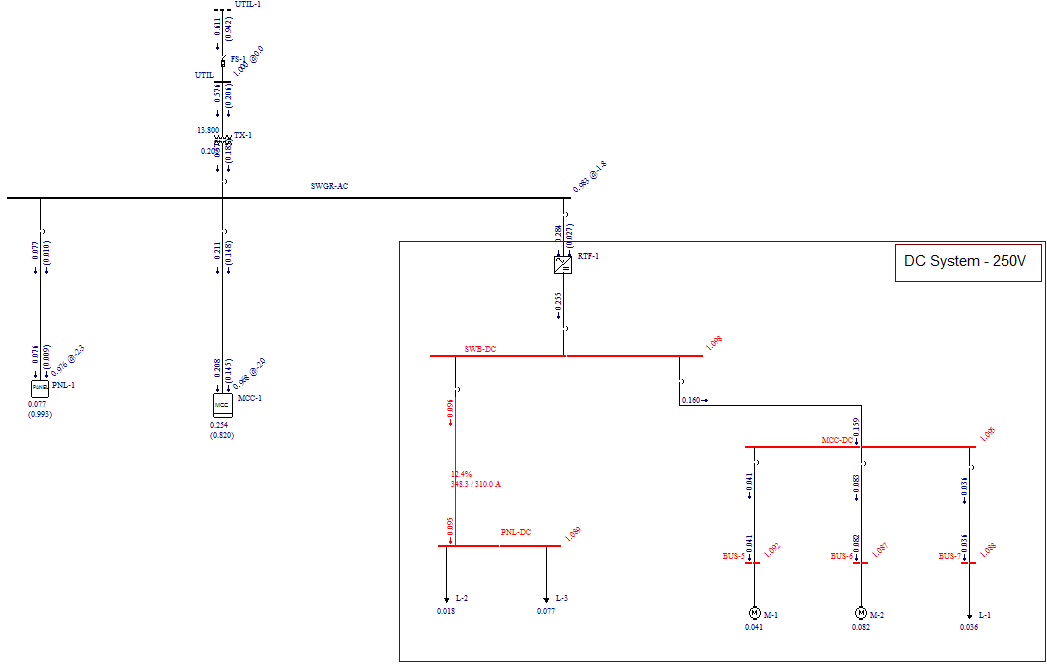
Figure 12: Power Flow Results