Plotting Bar Charts
Once you have defined plots, the plot viewer opens displaying bar charts whenever you click  Bar Chart. The bars show the per-unit voltage for defined buses and per-unit current for defined branch items at the respective harmonics.
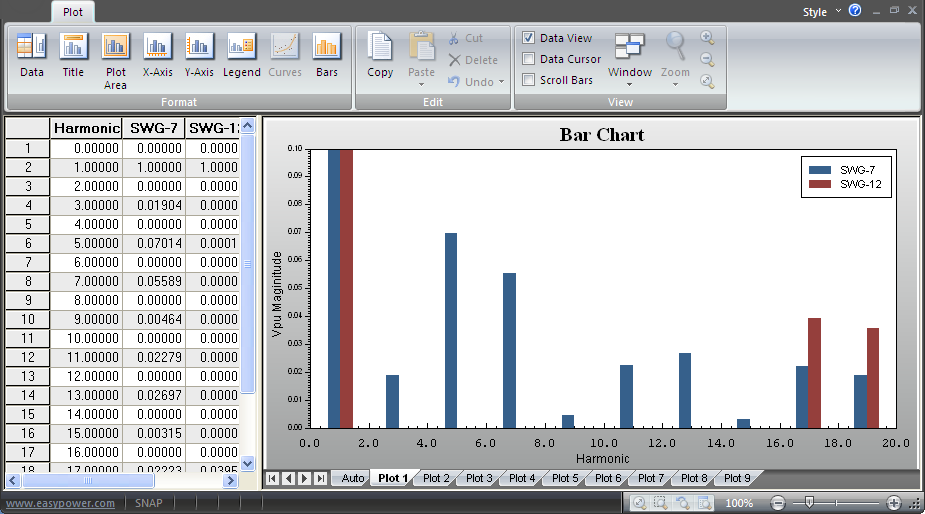
Figure 1: Plot Viewer Showing Bar Chart
- Select
 Harmonics Options and click the Plot Output tab. In the Summation Bar Chart Range section enter the range and step size of frequencies to be analyzed.
 - Select the Text Output tab and check any text reports for output. Click OK.
- Use
 Define Plots to add or remove items to be plotted.
 - Select Bar Chart. EasyPower displays the bar charts.
- Format plots if desired.