Tutorial - Power Flow Analysis
In this tutorial, you will be shown how to use several of EasyPower’s power flow analysis features. EasyPower uses the most robust and accurate algorithm ever developed: the Current Injection Method. The program also uses the latest in sparsity algorithm techniques to find the steady-state power flow conditions of an operating power system.
Power Flow Focus
To perform power flow analysis, you must be in the Power Flow focus.
- From the File menu, click Open File.
- Open the Simple.dez file in your Samples directory.
- Click
 Maximize on the one-line window, if needed, to fill the session window with the one-line.
 - Click
 Power Flow in the Home tab to open the Power Flow focus. The
Power Flow tab contains buttons that are used in power flow calculations.
Power Flow in the Home tab to open the Power Flow focus. The
Power Flow tab contains buttons that are used in power flow calculations.
Tip: If you are viewing the Start Page, you can click Open One-line instead.
Running Power Flow Analysis
- Click
Solve. EasyPower displays the power flow analysis of this small system.
The megavar flows are shown inside parentheses and the megawatt flows are not in parentheses. The per-unit voltages and power angles of each
bus are displayed at a forty-five degree angle (see figure below).
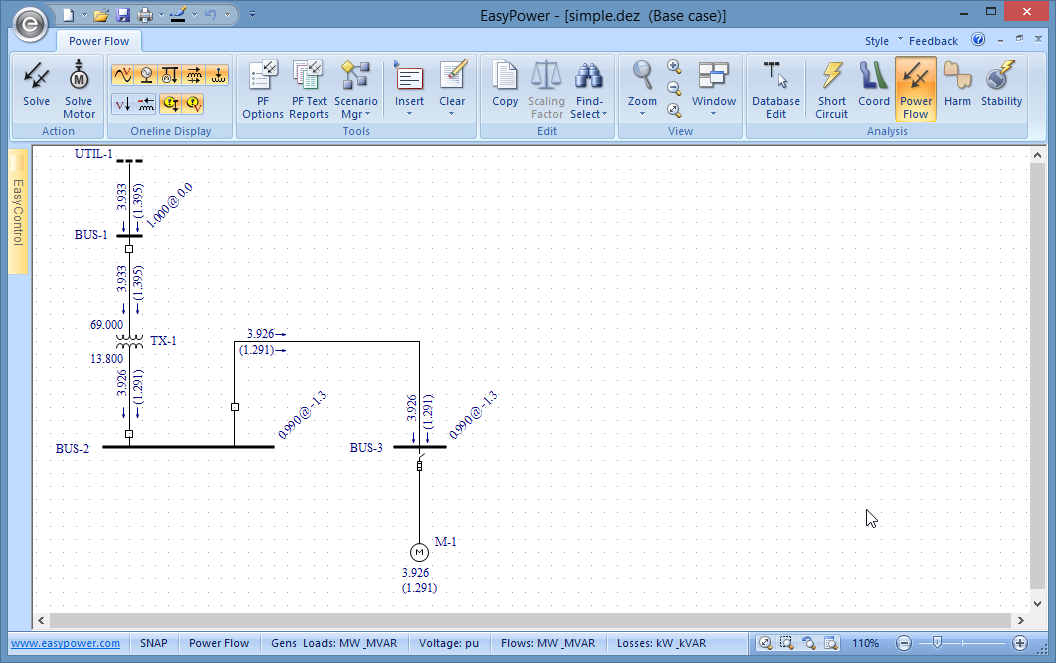
Figure 1: Power Flow Analysis
- Click
 Losses. The kW and kVAR losses in the transformer and cable are displayed (see figure below).
- Click
 Voltage Drop. The voltage drop percentages across the transformer and cable are displayed (see figure below).
The
 Overloads button is selected by default. Equipment items that are overloaded are highlighted red. Since no equipment in
Simple.dez is overloaded, nothing is highlighted.
Overloads button is selected by default. Equipment items that are overloaded are highlighted red. Since no equipment in
Simple.dez is overloaded, nothing is highlighted.
Note: EasyPower also highlights items that are within 10% of overload. This overload threshold can be adjusted in the PF Options dialog box.
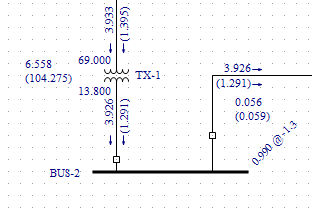
Figure 2: Power Flow With Losses Displayed
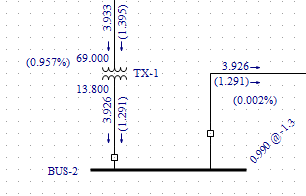
Figure 3: Power Flow With Percent Voltage Drops Displayed
Impact Motor Starting
After running power flow, the effect of one or more motors starting in your system can be analyzed. EasyPower computes the system impact of a starting motor at the time when the motor acts as a locked rotor.
- Double-click on the motor. A
Temporary Motor Data dialog similar to the one shown in the figure below is displayed.
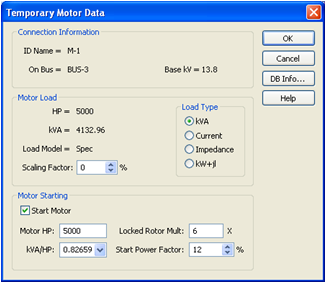
Figure 4: Temporary Motor Data Dialog Box
- Change the Scaling Factor to 0%. This indicates that the motor is not currently running.
- Select the Start Motor check box.
- Click OK.
- Click
Solve. This establishes your base case power flow before your motor starts. Notice the motor is drawing no
power.
- Click
 Solve Motor. The motor starting results display on your one line.
Notice the buses turn red. Their bus voltages are below the “Bus Undervoltage Threshold.” (The “Bus Undervoltage Threshold” defaults to within 5% of unity. This can be adjusted in the Tools > Power Flow Options dialog box on the Control tab.) In both power flow and motor starting analysis, you can quickly spot voltage problems in large systems by looking for red buses.
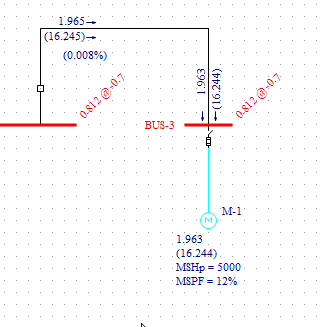
Figure 5: Motor Starting Analysis
Temporarily Changing Equipment Data
For fast contingency studying and what-if checking, you can run power flows after making temporary changes to the equipment
data. All modifications made to equipment data while in the Power Flow focus are temporary. The changes do not affect verified data
entered in
 Database Edit focus. Generators, utilities, transformers, motors, loads, capacitors, and shunts can all be temporarily
edited.
Database Edit focus. Generators, utilities, transformers, motors, loads, capacitors, and shunts can all be temporarily
edited.
- Double-click on the motor again.
- Clear the Start Motor check box, change the Scaling Factor to 120%, and then click OK.
- Click
Solve.
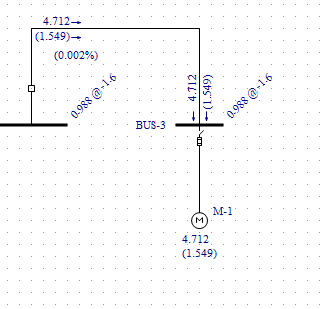
Figure 6: Motor With 120% Scaling Factor
Notice that the 120% motor load shown is greater than the 100% motor load. Changing the scaling factor of a motor lets you test different loading scenarios without changing the actual motor specifications.
Note: You can quickly scale multiple motors and loads by clicking Change Scaling Factor in the Power Flow tab. The changes are applied to the motors and loads on your one-line that are selected green. This provides a fast and easy way to check peak loading conditions, light loading conditions, future additions, and other factors prevalent to a power system.
Display Options
Click
 PF Options in the Power Flow tab, and then select the
One-line Output tab.
PF Options in the Power Flow tab, and then select the
One-line Output tab.
Observe the different one-line options available.
- The branch flows on the one-line include MW and MVAR, kVA and Power Factor, Current in Amps, and so on.
- The bus voltages display either Per unit, kV(LL), or V(LL) units.
- Units are displayed on the one-line by selecting the Show Units check box.
Text Reports
- While still viewing the Power Flow Options, select Text Output. A dialog box similar to the one shown below is displayed.
- Select the Create Detail Report check box, and then select IEEE/WSCC Format.
- Select the System Summary check box.
- Click OK.
- Click Solve.
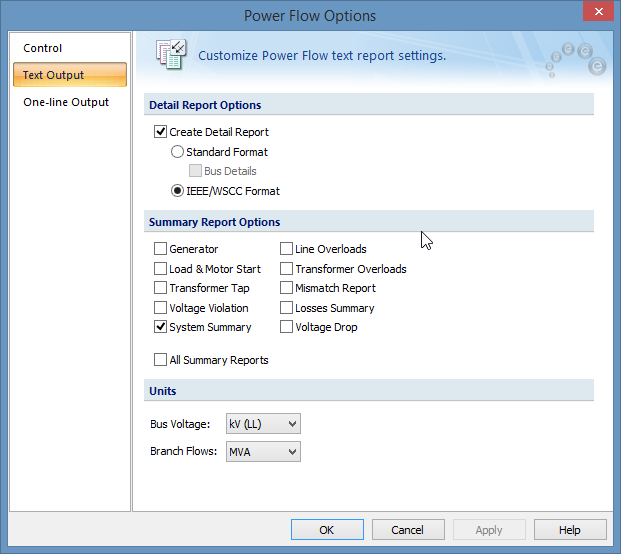
Figure 7: Power Flow Text Output Dialog Box
- Two power flow text report windows are created. You can view these reports by selecting either the Power Flow Summary or Power Flow Detail
report from the
 Window button.
Tip: You can also double-click on the window icons created in the lower left corner.
Conclusion
This has been a brief overview of EasyPower’s power flow program. Features such as LTCs, generator voltage control,
motor group modeling, and many others are also available.
The EasyPower Help topics cover this and other features in greater
depth. To open Help, click  Help in the upper-right corner of the EasyPower window or press F1.