Show Original Curve
If you drag the protective device settings in the TCC plot to new values and would like to view the original settings at the same time, right-click on the curve and select Show Original Curve from the context menu. A shadow curve appears with the original settings as shown in the picture below.
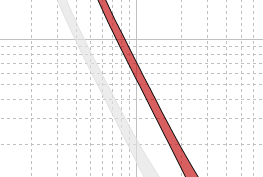
Figure 1: Show Original Curve