Editing TCC Curves
Dragging TCC Curves
After plotting TCC curves, you can modify the curves by using the mouse to drag the curves to the desired position. To do this:
- Place the pointer over the TCC plot you wish to modify.
- Move the pointer along the curve until a double-headed arrow appears.
- Drag the curve to the desired position. Dragging is only effective when the double-headed arrow appears. A note appears telling you which device corresponds to the TCC curve to which you are dragging your original curve. The note tells you the manufacturer, type, style, device name, and the information being modified. An arrow also appears that shows how far you have dragged the curve from its original position.
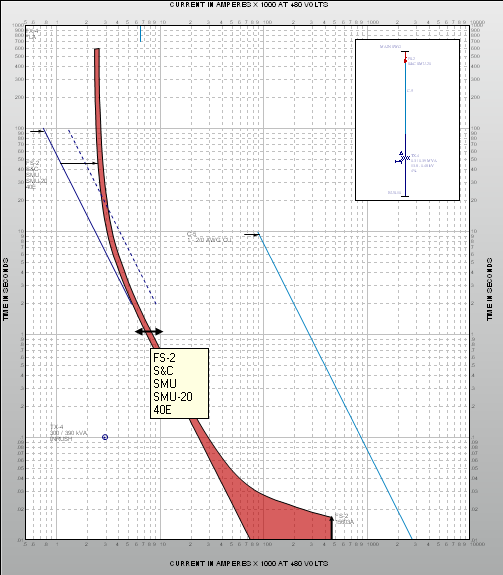
Figure 1: Dragging Curves in Coordination
Dragging the TCC curve changes different information for different devices. For example, dragging a fuse on a TCC curve changes the size of the fuse, as shown below.
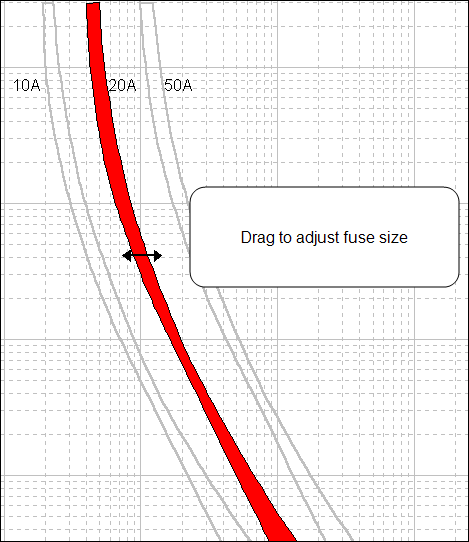
Figure 2: Dragging a Fuse TCC
Dragging an MCCB on a TCC curve changes the instantaneous setting of the MCCB, as shown below.
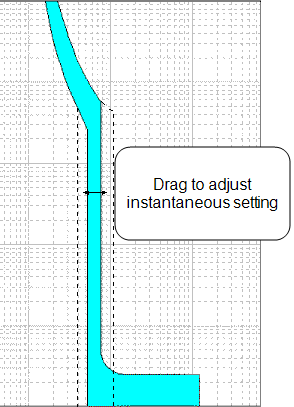
Figure 3: Dragging an MCCB
Dragging a relay on a TCC curve can change several things about the relay including time dial setting, instantaneous pickup, and instantaneous delay of the relay. All of these features are shown below.
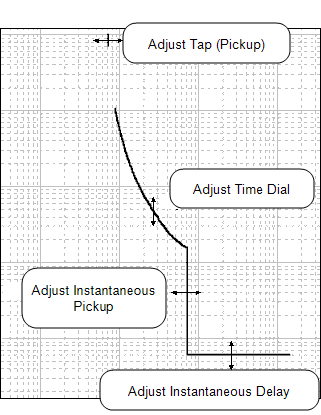
Figure 4: Dragging a Relay
After you have dragged the curve to the desired position, note that the temporary data specifying the device is changed to match what has been plotted. You can save the changes that you have made by dragging the curve by placing your mouse over the curve that you wish to modify, right-clicking, and selecting Edit Temporary. This opens a Temporary Data dialog box where you can temporarily change the data to do further evaluation. If close the TCC curve dialog box without saving the data that you have modified, you are asked if you want to save the data.
Note: If you are not able to drag the desired curve, use the Temporary Dialog box to modify, as described in Temporary Data Dialog Boxes.
Dragging Pickup and FLA Tick Marks
When you plot relay curves, a tick mark appears near the top of the curve representing the pickup amps. Similarly, a tick mark representing the FLA appears when plotting the thermal limit curve of a transformer. When several tick marks are present about the same ampere value or when they are overlapping, the tick marks for different devices are automatically arranged at different vertical positions so that the tick marks are clearly seen. This is done only to obtain better visibility, and has nothing to do with the time coordinate.
You can drag these tick marks up or down within a decade of time interval. To drag the pickup or FLA tick marks, move the pointer arrow over the tip of the tick mark so that a double-headed vertical arrow appears. Drag the tick mark up or down by left-clicking.
Note: Dragging with a horizontal double-headed arrow results in a change to the pickup value.
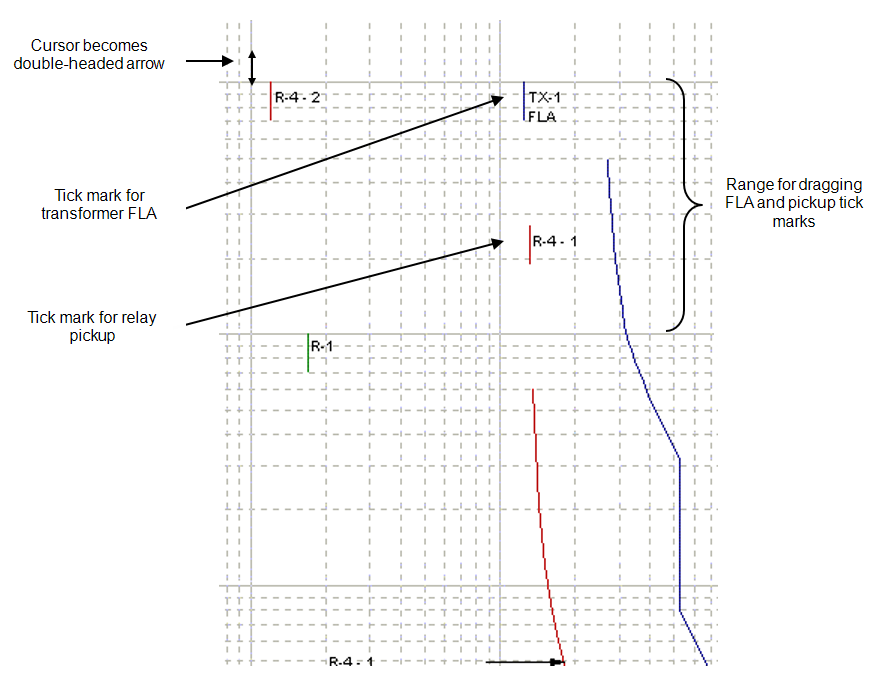
Figure 5: Arranging FLA and Pickup Tick Marks
Curve Insertion
Curve insertion inserts equipment curves into a TCC plot. These curves do not have to correspond to a one-line equipment item.
While in a TCC plot, click  New Curve to select which curves to add. Alternatively, you can right-click on the TCC and select Insert Curve, and then select the equipment you want to insert. In the equipment dialog that is displayed, you can specify an equipment ID name and select the device type, style, settings or parameters.
Add Item Existing in One-line
You can insert an existing component onto the one-line without recreating the TCC plot.
To add an existing item’s curve to the TCC plot, the item needs to be added to one-line. The curve then appears in the TCC plot. To insert an existing item into the one-line:
- Select the component to which the item is connected in one-line.
- Do one of the following:
- Click New Curve to view your choices, and click
 Existing Item from the list.
 - Alternatively, you can right-click on the item in the one-line window and select Insert Existing Item from the context menu.
- Click the check box corresponding to the item or items you would like to add to the one-line. The selected items added to the one-line are now seen in TCC plot.
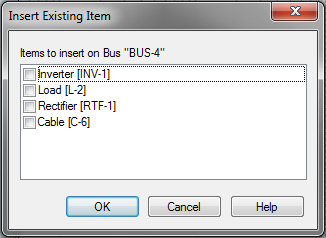
Figure 6: Selecting Item to Insert
To add an item not connected to an existing component, you need to add all the branches until that item is available to be added.
Deleting Curves
To delete a curve from the TCC plot, select the curve and press DELETE. If the device is shown in the one-line of TCC plot, the device is not removed from the one-line.
Note: After you delete a curve you cannot undo the delete action.
Deleting Devices from One-line of TCC Plot
To delete a device from the one-line of the TCC plot, select the device in the one-line and press DELETE. In the toolbar style, you can use Edit > Delete. Deleting the device from the one-line also deletes the corresponding curve from the TCC plot.
Note: You cannot undo the delete action.
Inserting Shifted Curves
Inserting shifted curves shows the dotted shadow curve of protective device curves based on transformer phase shifting. To account for the phase shift due to connection type (such as delta/star) and unbalanced fault, the shadow of a curve can be plotted with a shift in the current by 58%, 87%, 115% and 173%.
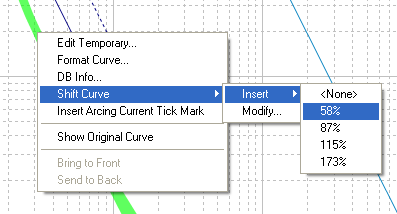
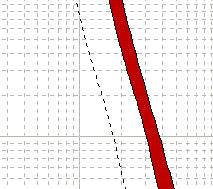
Figure 7: Inserting Shifted Curve 58% Shifted “Shadow” Curve (dotted line)
To insert a shadow curve for any equipment curve, first select the curve. Right-click on the curve and from the context menu click Shift Curve > Insert and then select the desired percentage.
Shifting Curves by Modifying
You can also shift curves by a percentage you specify. This is done to coordinate devices in parallel paths with an upstream or downstream device. For example, if there were 2 parallel cables with one limiter each of 100A rating the effective total would be 200A. You can shift the 100A fuse curve by 200%. You can also shift fuse curves along the time axis to account for the pre-loading of fuses.
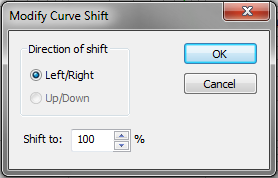
Figure 8: Modify Curve Shift
The following user-specified curve shifting methods are available:
- Left/Right: You can shift the curve along the current axis by the specified percent.
- Up/Down: Shift along the time axis.
Show Original Curve
If you drag the protective device settings in the TCC plot to new values and would like to view the original settings at the same time, right-click on the curve and select Show Original Curve from the context menu. A shadow curve appears with the original settings as shown in the picture below.
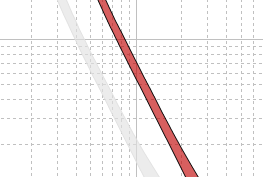
Figure 9: Show Original Curve
Changing Overlapping Curve Position
You can change the position of overlapping curves by bringing it to the front or sending it back. To do this, right-click on the curve you want to reposition, and select either Bring to Front or Send to Back. This feature is applicable only for opaque curves, and not for semitransparent curves.
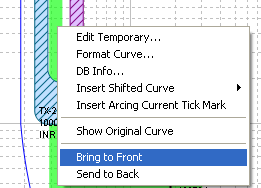
Figure 10: Changing Position of Opaque Curves
More Information
| Coordination with PowerProtector™ | Plotting a TCC Curve from a One-Line |
| Plotting Motor Starting Curve on TCC | Plotting Items in MCCs and Panels |
|
|