 Harm (toolbar menu: Analysis > Harmonics) to open the Harmonics focus. There are some criteria that need to be met before entering an analysis focus, and some analysis features are the same. Review Analysis Overview for more information.
Click Harm (toolbar menu: Analysis > Harmonics) to open the Harmonics focus. There are some criteria that need to be met before entering an analysis focus, and some analysis features are the same. Review Analysis Overview for more information.
EasyPower includes three major types of harmonic analysis:
Frequency scans show how a system under study responds to an injected current at increasing frequency. The output of a frequency scan is a plot of per unit voltages, per unit currents, or both. From these plots you can derive results such as voltage and current amplification, resonant points and natural filter points. Frequency scanning utilizes a 1.0 per unit current injection at a single, user-selected location. Since Z=V/I, a 1.0 per unit current makes Z=V. Therefore, the bus voltage at the point of injection is the driving point impedance.
To obtain a frequency scan at a bus by injecting current at the same bus, double-click on the bus while in the Harmonics focus. This displays a window with a plot and spreadsheet as shown below. To obtain frequency scan at a bus by injecting current at another bus, you need to define plots. The scan of bus at which current is injected appears on the AutoPlot tab.
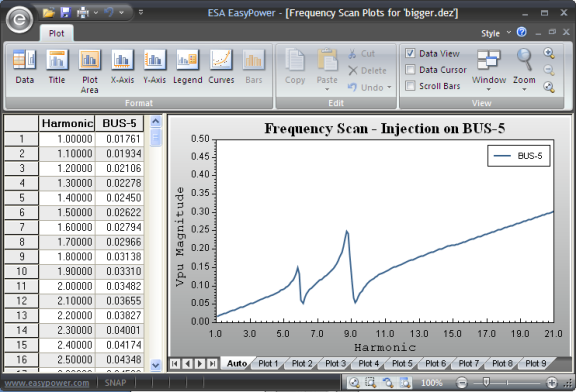
Figure 1: Frequency Scan at a Bus
The plot feature in the Harmonics focus enables you to select as many as ten plots with up to five buses or items each. For buses, the per-unit voltage is plotted; and for branch items, the per unit current is plotted.
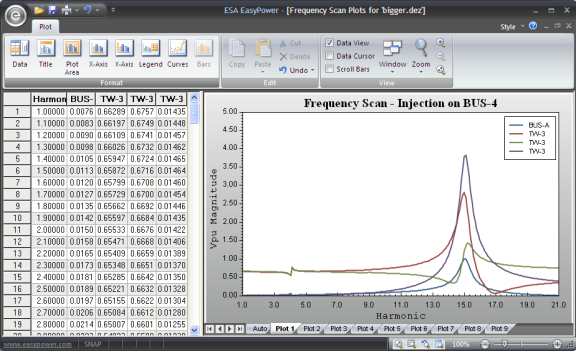
Figure 2: Plot Viewing Window
To enter the Define Plot mode:
 Define Plots (toolbar menu: Plot > Define Plots). This activates the Plot Define ribbon and provides the plot
  Select pointer.
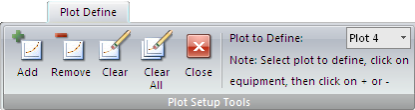
Figure 3: Plot Define Ribbon
 Add or
  Remove to add or remove items from the plot.
 Close.
  Harmonic Options and click the Plot Output tab. In the Frequency Scan Range section enter the range and step size of frequencies to be scanned.
 Tip: You can also open the dialog to format text output by clicking  Harmonics Reports.
Note: The plot viewer is limited to 5000 data points per item. Selecting a very small step size (for example, 001pu) may limit the scan range and increase computer processing time.
Define Plot to add or remove items to be plotted. Scan (toolbar menu: Solve > Frequency Scan). EasyPower performs the frequency scan and opens the plot viewer. You can also double-click the bus to injection on.
Tip: When the scan range is already set and there are no plots defined, you can automatically plot the voltage for a bus by double-clicking on that bus.
Even though EasyPower opens the plot viewer automatically, there are many aspects of the plot window that you can control.
The Plot Window has scroll bars which function as described in Moving Around On the One-line. The zoom buttons are also available for viewing plots, and they work as discussed in Zooming In and Out.
To view any of the ten different plots, click the tab for that plot. The default is to show only a few of the tabs. Click the arrow keys to the left of the tabs to scroll through the other tabs.
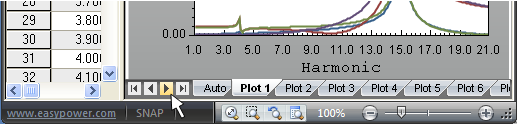
Figure 4: Scrolling Through Plot Tabs
To view a separate Y-axis for each curve, click  Y-Axis (Format Y Axis). On the Appearance tab, select the Multiple Y-Axis check box.
To toggle whether data is viewed or just the plot, from the Plot ribbon, select the Data View check box. To view more of the data window, use the vertical splitter window pointer to drag the window boundary one way or the other. Change column widths by using the column resizing pointer or by using the Format Plot Data dialog box.
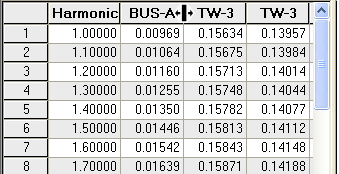
Figure 5: Changing Column Boundaries
Selecting data is performed by using the same method as the device library. Selected data can be copied to the clipboard and then pasted into other applications.
The Format group in the Plot ribbon has several buttons for formatting the plot. Each command (Data, Title, Plot Area, X Axis, Y Axis, Legend, and Curves) opens a different dialog box for customizing that respective area.
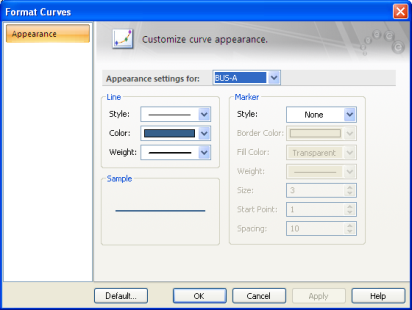
Figure 6: Format Curves Dialog Box
These dialog boxes can also be opened by double-clicking on the area to be formatted. For example, double-clicking on any of the curves opens the Format Curves dialog box, and enables formatting of one or all of the curves.
Right-click in either the plot or data area to bring up a context menu for that area containing the Format and View commands.
To change the default settings, open the appropriate format dialog box and change the desired parameters. Then click the Default button in the lower-left corner. Any changes made will be reflected in all new plots.

Figure 7: Quick Access Toolbar
If the plot viewer is open, click  Print on the Quick Access Toolbar to open the Print Plot dialog box.
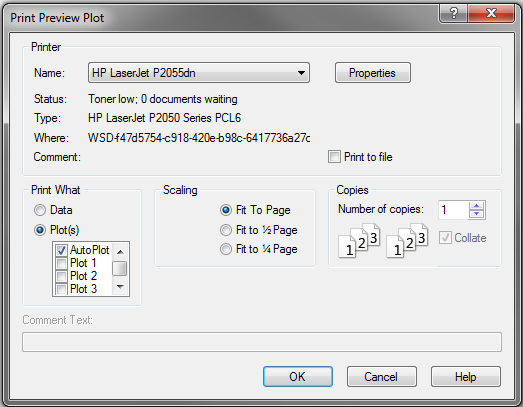
Figure 8: Print Plot Dialog Box
The Print Plot dialog box is similar to the others discussed in Printing and Plotting. However, the options under Print What control whether to print Data or Plots. EasyPower gives the option of printing multiple plots at the same time.
When Data is selected, the Scaling field is unavailable. If Plots is selected, Scaling remains available, and the plot size (full, ½, or ¼) is determined by the scaling options.
Clicking  Single Point Current Flow or
  All Source Current Flow in the Harmonics ribbon displays equipment currents and bus voltages.
Harmonics Options. On the Control tab, in the Harmonic Current Flow section, enter the current flow frequency to be injected. Select the Text Output tab and select any output text reports. Click OK. Single Point Current Flow and EasyPower displays the bus voltages throughout the system, in either kV or per-unit. Note: You can set the kV type display on the One-line Output tab of the Harmonic Options dialog box.
All Point Current Flow and EasyPower injects harmonic currents at the specified frequency for every harmonic source in the system that contains that frequency in its harmonic spectrum. These currents are injected at the magnitude and angle specified in the Harmonics tab of the source equipment item. Buses do not need to be selected prior to solving. The output is kV or per-unit, as selected.Summation analysis performs a system solution using injected harmonic currents from each harmonic source defined. Results are accumulated over all available injection frequencies and presented on the one-line and in text reports.
Most of the remaining buttons control which results of summation are displayed on the one-line.
 Summation in the ribbon (toolbar menu: Solve > Summation) and only the results for the sections selected are displayed.
 These results are stored so viewing is as fast as clicking different buttons. To solve for summations of all harmonic contributions, click  Summation without selecting any item on the one-line.
The different summary report options are available by selecting the Text Output tab of the Harmonic Options dialog box.
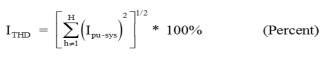
Branch currents results consist of  ITHD,
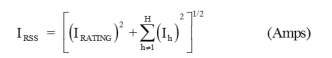
ITHD,  IRSS, and
  IT Product. The calculations are:

Losses and derating of branch equipment consists of  Losses,
 ![]() Transformer Derating via ANSI/IEEE C57.110-1986,
Transformer Derating via ANSI/IEEE C57.110-1986,  K Factor, and
  Conductor Derating. The results are displayed at the center of a branch item. The calculations for these figures of merit are:


![]()
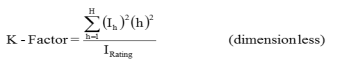
The K-factor equation is based on UL 1561, and differs slightly from the IEEE 519 K-Factor which in turn is based off of ANSI C57.110. In the K-Factor equation above, the value IRating is the transformer name plate rating and Ih is the current magnitude for each harmonic.
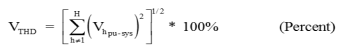
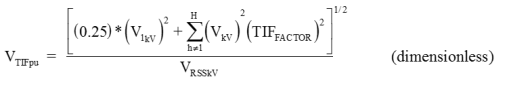
Voltage results are displayed at the right end of a bus and consist of  VTHD,
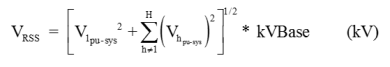
VTHD,  VRSS,
VRSS,  Telephone Interference Factor, and
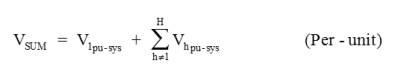
  VSUM. These are calculated using:
When Harmonics Options > Control is set to calculate based on Positive Sequence, the voltage THD values displayed are positive sequence values. When the option is set to calculate based on Positive Sequence with Zero Seq. Triplens, the voltage THD values displayed are zero sequence values.
The phase voltage for systems with harmonics zero sequence currents can be calculated from the sequence voltages:
Vph = (V1 + V2 +V0) / 3
Once you have defined plots, the plot viewer opens displaying bar charts whenever you click  Bar Chart. The bars show the per-unit voltage for defined buses and per-unit current for defined branch items at the respective harmonics.
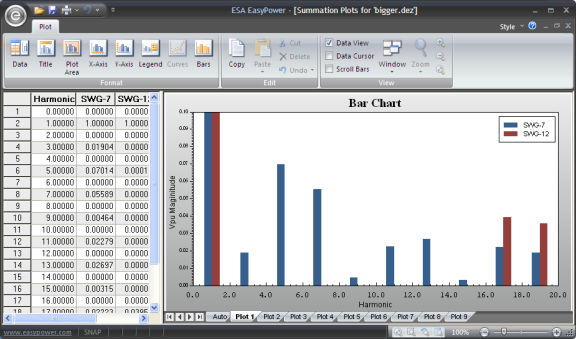
Figure 9: Plot Viewer Showing Bar Chart
 Harmonics Options (toolbar menu: Tools > Harmonic Options) and click the Plot Output tab. In the Summation Bar Chart Range section enter the range and step size of frequencies to be analyzed. Define Plots to add or remove items to be plotted. Bar Chart (toolbar menu: Solve > Summation Bar Chart). EasyPower displays the bar charts.
| Harmonics with Spectrum™ | |
| Harmonics Options |