Format Plot Area
Coordination enables you to format several aspects of the TCC plot area. You can format the plot area by right-clicking on a blank area in the TCC and selecting Format Plot Area. This dialog box contains tabs that control the appearance, TCC curves, grid, scale, and text for the plot.
Default
Click Default at the bottom of the dialog box to change the default settings to use the current settings. The settings for the Appearance, Grid and Text tabs are stored as default. However, the settings in the Scale tab are not stored as default.
Appearance Tab
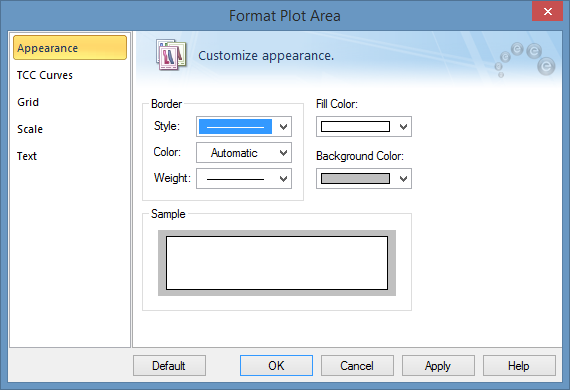
Figure 1: Format Plot Area Dialog Box
You can change the border size, color, style, weight, and background color of the plot area.
TCC Curves Tab
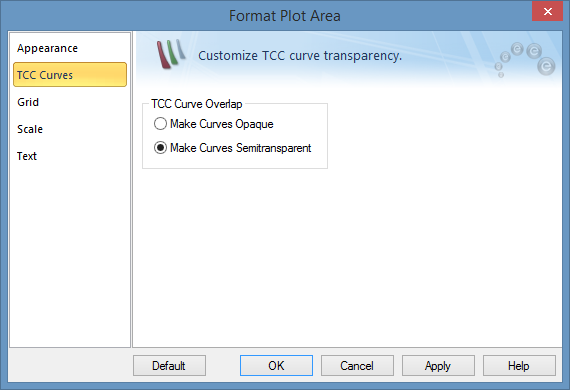
Figure 2: TCC Curves tab of Format Plot Area Dialog Box
Options on this tab format all curves in the TCC plot as opaque or semitransparent. When curves are selected as opaque, the individual curves can be brought forward or sent backward. This is not applicable when the curves are semitransparent.
![]()
Figure 3: TCC Curves: Opaque (left); Semitransparent (right)
Grid Tab
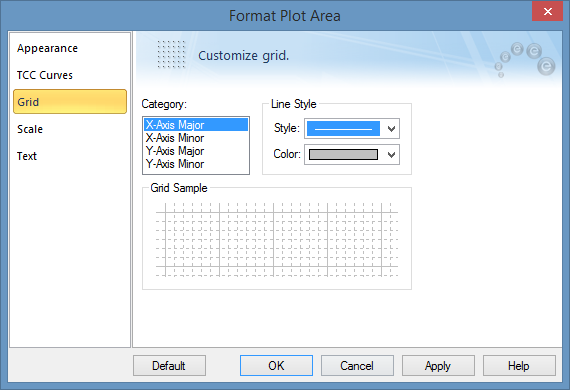
Figure 4:
Use to change the line style and color for both x- and y- major and minor axes.
Scale Tab
By changing the Reference kV and Current Scale values, you can modify the current scale (or the horizontal axis) of the TCC plot. The time scale remains the same.
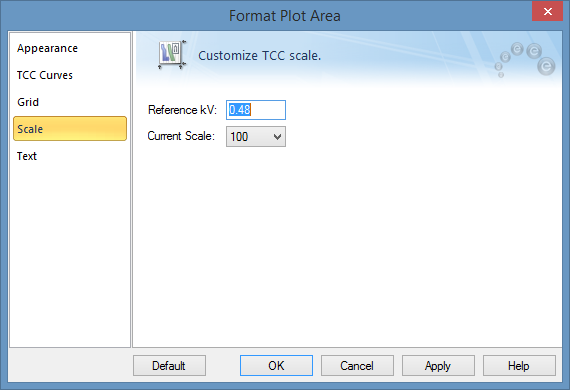
Figure 5: Scale Tab of Format Plot Area Dialog Box
|
Options |
Description |
|---|---|
|
Select the voltage level through which the current is to be seen. The method of calculation is similar to those involving transformation ratios. When the TCC of a high voltage device is plotted with the Reference kV set to the low voltage, then the current shown in the plot is equal to the actual current times the ratio of device voltage to Reference kV. |
|
|
Current Scale |
Current Scale sets what one unit on the current axis equals to. Changing the scale shifts the TCC plot left or right. The choices for Current Scale values are 0.1, 1, 10, 100, etc. Unlike Reference kV, changing current scale does not change the current values in the TCC plot. |
Example: Reference kV and Current Scale
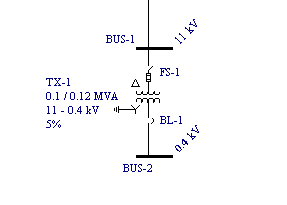
Figure 6: One-line Example with Two Voltage Levels
In the figure above, the transformer TX-1 is protected by the high voltage fuse FS-1 at 11kV and the low voltage breaker BL-1 at 0.4kV. The TCC plot of both devices is shown below. Notice that the current values in the TCC plots are higher for reference voltage of 0.4kV.
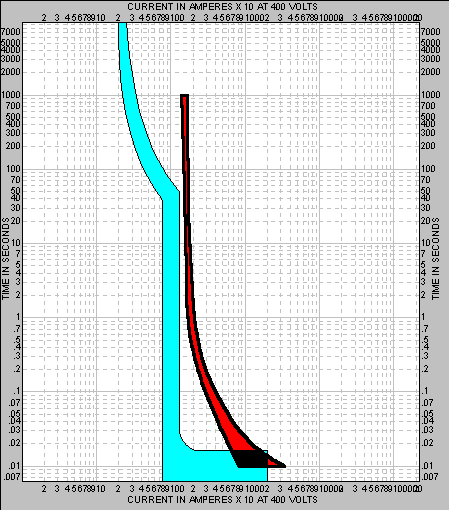
Figure 7: TCC Plot for Current Scale of 10 and Reference kV of 0.4
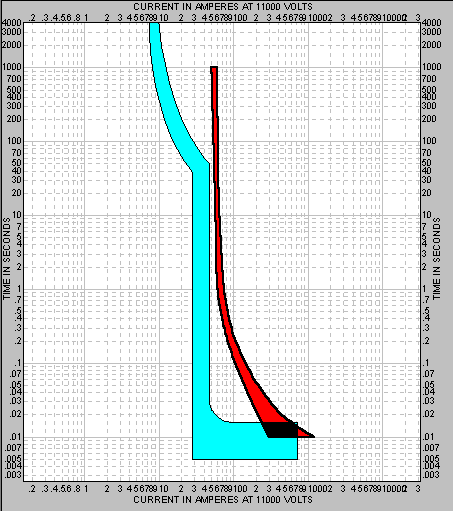
Figure 8: TCC Plot for Current Scale of 1 and Reference kV of 11
Text
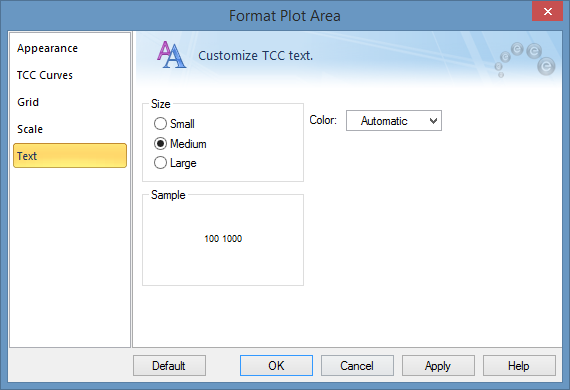
Figure 9: Text Tab of Format Plot Area Dialog Box
Use to change the size and color of the text around the curve.