Harmonics Plot Output
Select  Harmonics Options, and click the Plot Output tab to control the Frequency Scan plots and the Summation Bar Chart plots.
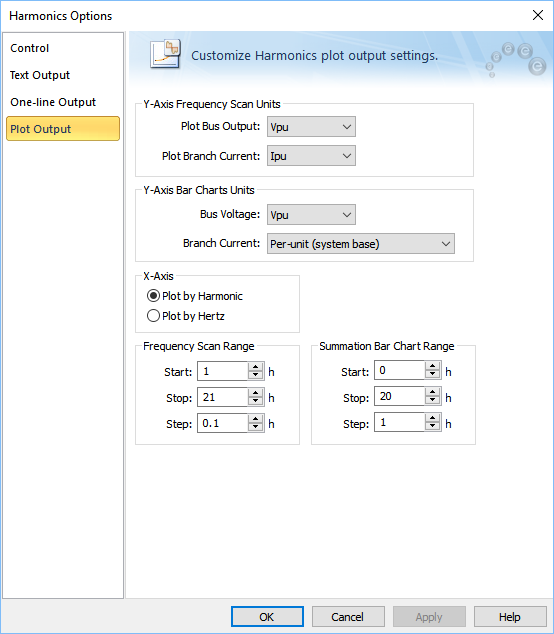
Figure 1: Plot Output Tab of the Harmonics Options Dialog Box
|
Option |
Description |
|---|---|
|
Y-Axis Frequency Scan Units |
|
|
Plot Bus Output |
Specify the unit for frequency scan Y-axis. The choices are kV(LL), Vpu, Ohms, Zpu, Rpu, Xpu, and Angle (Deg). |
|
Plot Branch Current |
Specify the unit for frequency scan Y-axis for branches such as cables and transformers. The choices are Ipu and Amps. |
|
Y-Axis Bar Charts Units |
|
|
Bus Voltage |
Specify the unit for Summation Bar Chart Y-axis. The choices are Vpu, V(LL) and kV(LL). |
|
Branch Current |
Specify the unit for frequency scan Y-axis for branches such as cables and transformers. The choices are Amps, Per-unit (system base) and Per-unit (Equipment rating base). |
|
X-Axis |
|
|
X-Axis |
Set the x-axis units to either frequency in hertz or harmonic multiple. |
| Frequency Scan Range | These fields control the Start and Stop points and the Step size for frequency scans. Be aware that a data point will be generated and output for each step. Since the plot output is limited to 5000 data points per curve, selecting a very small step size may limit the scan range. |
| Summation Bar Chart Range | When plots are defined, selecting Summation opens the plot viewer and displays bar charts. These fields specify the bar chart range. |