Plotting a TCC Curve from a One-Line
To plot a Time Current Characteristic (TCC) curve from a one-line diagram, you must first enter the Coordination focus by clicking  Coordination on the Home tab. Select the devices for which you would like to plot TCC curves by doing one of the following:
- Select only one item by clicking on the item.
- Select more than one item by holding down the CTRL key and selecting items individually, clicking the items that you would like to plot.
- Drag the mouse to form a box around the items you would like to plot.
After selecting the items, click  Plot TCC. This causes the TCC curve of the selected items to appear next to a one-line diagram of the selected items. If there is not sufficient data to plot an item, the following message appears:
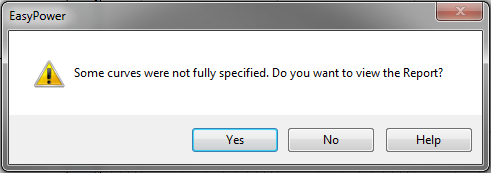
Figure 1: Items Not Fully Specified Message
Click Yes to produce a report informing you of areas not specified for the items that coordination is unable to plot and the data that is missing. If you click No, EasyPower does not plot the TCC curve for that item. If more than one item is selected to plot TCC curves, then only the items not fully specified are eliminated from the plot.
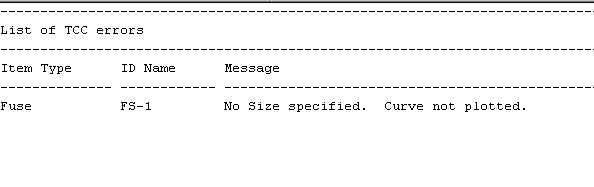
Figure 2: Error Report for Unspecified Data
If all data is entered correctly, then EasyPower plots TCC curves for all items selected as shown below.
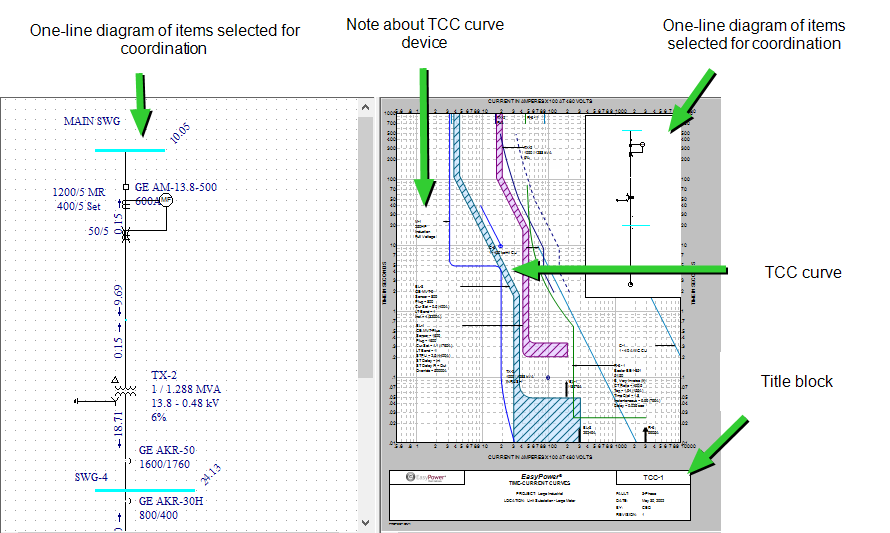
Figure 3: Coordination Plot of TCC Curves