Run a Power Flow Analysis
Open the Power Flow Focus
Open the Power Flow focus by clicking  Power Flow. If one or more items are unconnected or have incomplete data, you will be notified at this time. Items with incomplete data are highlighted in red. An error message dialog box appears. To see the errors, click Yes. An error report appears as shown below, listing the equipment with incomplete data.
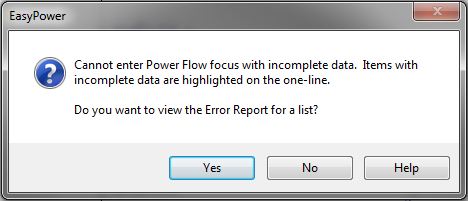
Figure 1: Error Message – Incomplete Data
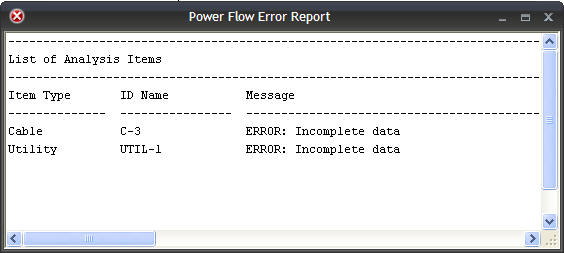
Figure 2: Error Report – Incomplete Data
Double-click on the item in the one-line to open the item's data dialog box, and enter any missing data. Then open the Power Flow focus again.
Solve Base Case Power Flow
Click Solve to see all the flows.
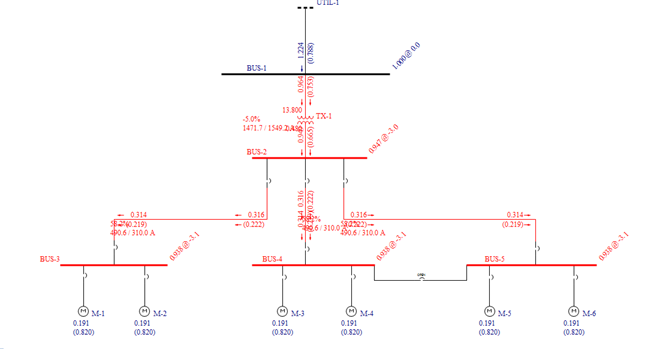
Figure 3: Solved Flow Example
You can see that we underestimated the amount of space to leave for analysis the results. EasyPower's dynamic graphics make this easy to fix.
Adjusting One-line for Results Readability
Drag the buses, equipment, and ID names as needed to see so all of the analysis numbers.
After adjusting the one-line, you can save the updated arrangement with the Save command even though you are still in the Power Flow focus.
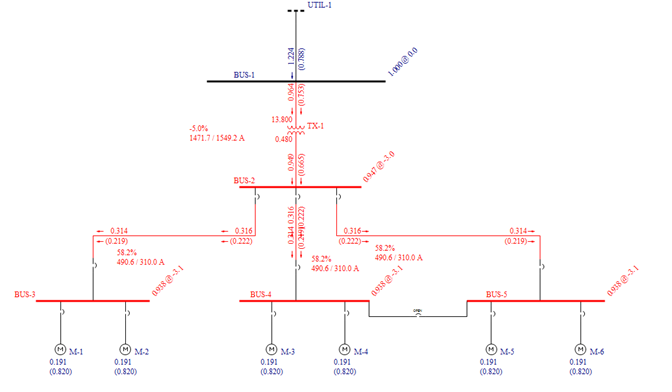
Figure 4: Better Readability in One-line
Interpreting the Results
The power flow solution is initially displayed in megawatts and megavars. You can change this to kilowatts and kilovars if desired by clicking PF Options > One-line Output on the Power Flow tab. Flow direction is indicated by the arrow. MVAR flow is indicated by the value placed in parenthesis ( ). The numbers beneath the motors show the actual loading of each motor.
Voltage is shown on the right-hand side of each bus at a forty-five degree angle. The default voltage unit is per-unit, but kV can be shown instead if desired. The number after the "@" is the voltage angle (excluding 30° phase shift) in degrees. This is the voltage angle in comparison to the voltage angle at the swing bus (usually 0°).
Notice that the flow into each branch is different than the flow out of each branch. This is due to the line losses associated with each conductor and transformer.
There are many other power flow display commands available. You can use the buttons on the Power Flow tab to change which values and warning conditions are displayed.
If the Power Flow tab has  Voltage Violation selected, most of the buses will be highlighted in red since their voltages are outside the warning threshold range as determined in Power Flow Options > Control.
If your results do not match these numbers, recheck the database dialog boxes for each item, comparing them to the dialog boxes shown in this tutorial. To do this, you must first get back to the Database Edit focus by clicking  Database Edit.