Generator - TCC Tab
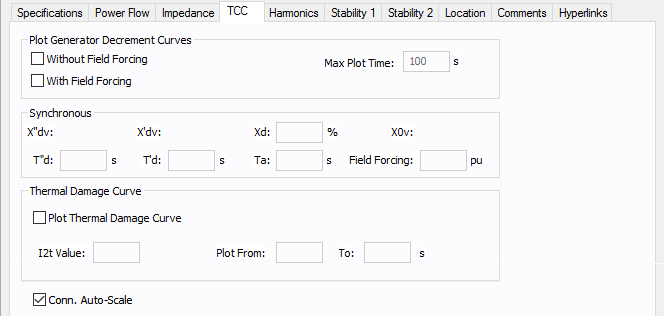
Figure 1: TCC tab of Generator Data dialog
| Option | Description |
|---|---|
|
Plot Generator Decrement Curves |
You can plot short circuit decrement curves “with” and “without” excitation field forcing for comparison purposes.
|
| Synchronous | |
|
Xd |
Synchronous reactance of the generator, expressed as a percent. |
|
T”d |
Direct axis sub-transient short circuit time constant. |
|
T’d |
Direct axis transient short circuit time constant in seconds. |
|
Ta |
Armature time constant in seconds. A typical generator datasheet will provide the Ta value. However, some manufacturers may not provide Ta in the datasheet. The armature time constant is associated with the rate of change of dc current in the stator when the generator is subjected to a 3-phase fault. Ta for different types of generators is provided in the book “Power System Control and Stability,” by Paul M. Anderson and A. A. Fouad, IEEE Press, 1994. Ta = (Ld’ + Lq) / 2r Where Ld’ is the d axis transient inductance and Lq is q axis inductance. A typical value of Ta is 0.15 seconds for fault on the machine terminal. Prabha Kundur’s book “Power System Stability and Control”, McGraw-Hill, 1994, provides the following equation for Ta: Ta = (Ld” + Lq”) / 2/ Ra Typical value for Ta lies between 0.03 and 0.35s. |
|
Field Forcing |
Forced excitation current at a given load expressed as per unit value of field current at no load, Ifd0. |
|
Thermal Damage Curve This section allows you to plot “I^2t” thermal damage curve for the generator. |
|
|
Plot Thermal Damage Curve |
Select this check box to enable plotting of the damage curve and to enter data for this section. |
|
I2t Value |
This defines the (I^2)t line for the damage curve. I is in per-unit of generator rated current and t is in seconds. If I2t Value is 20, then the extrapolated damage curve line would intersect with the FLA of the generator at 20 seconds. |
|
Plot From/To |
The damage curve is drawn on the TCC plot within these values as the lower and upper limits in seconds. |
|
Conn. Auto-Scale |
When this check box is selected, the program automatically scales the TCC curves based on the phase connection type. Traditionally, for 3PH curves in a TCC, scaling the curves based on the reference voltage is adequate. If a line-to-neutral connected 1PH device is to be plotted with an upstream 3PH device, then the LN connected 1PH curve needs to be shifted by a factor of the SQRT(3) in addition to the voltage-based scaling. Similarly, if a line-to-neutral connected 1PH device is to be plotted with an upstream 1PH-3W device, then the LN connected 1PH curve needs to be shifted by a factor of the 2 in addition to the voltage-based scaling.When the check box is not selected, scaling based on the phase connection type is not applied. The check box status for individually stored TCC plots can be different. The default for new TCC plots is obtained from the database for the device. |
More Information
- Generator Data
- Database Dialog Box Toolbar
- Generator - Connection Information
- Generator - Specifications Tab
- Generator - Power Flow Tab
- Generator - Impedance Tab
- Generator - Harmonics Tab
- Generator - Stability 1 Tab
- Generator - Stability 2 Tab
- Generator - Reliability Tab
- Generator - Location Tab
- Generator - Comments Tab
- Generator - Hyperlinks Tab
- Generator - Collected Data Tab
- Generator - Media Gallery Tab