Formatting Plots
The Format group in the Plot tab has several buttons for formatting the plot. Each command (Data, Title, Plot Area, X Axis, Y Axis, Legend, and Curves) opens a different dialog box for customizing that respective area.
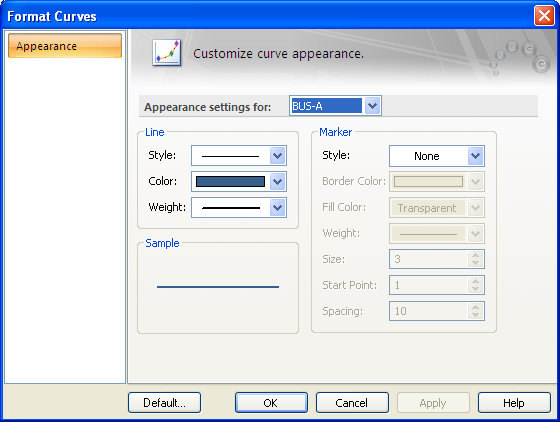
Figure 1: Format Curves Dialog Box
These dialog boxes can also be opened by double-clicking on the area to be formatted. For example, double-clicking on any of the curves opens the Format Curves dialog box, and enables formatting of one or all of the curves.
Right-click in either the plot or data area to bring up a context menu for that area containing the Format and View commands.
To change the default settings, open the appropriate format dialog box and change the desired parameters. Then click the Default button in the lower-left corner. Any changes made will be reflected in all new plots.