Viewing Plots
The Plot Window has scroll bars which function as described in Moving Around on the One-line. The zoom buttons are also available for viewing plots, and they work as discussed in Zooming In and Out.
To view any of the ten different plots, click the tab for that plot. The default is to show only a few of the tabs. Click the arrow keys to the left of the tabs to scroll through the other tabs.
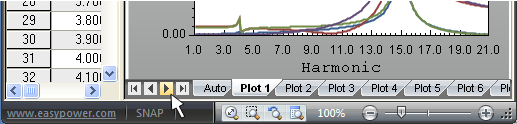
Figure 1: Scrolling Through Plot Tabs
To view a separate Y-axis for each curve, click  Y-Axis (Format Y Axis). On the Appearance tab, select the Multiple Y-Axis check box.
To toggle whether data is viewed or just the plot, on the Plot tab, select the Data View check box. To view more of the data window, use the vertical splitter window pointer to drag the window boundary one way or the other. Change column widths by using the column resizing pointer or by using the Format Plot Data dialog box.
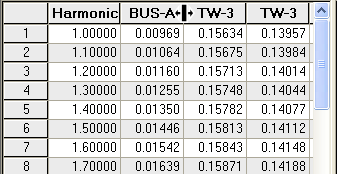
Figure 2: Changing Column Boundaries
Selecting data is performed by using the same method as the device library. Selected data can be copied to the clipboard and then pasted into other applications.