Viewing All Scenarios or Only Worst Case Results
The Arc Flash Scenario Comparison Report can show either all scenarios for each bus or just the worst case scenario for each bus. To change the view, select either All Scenarios or Worst Scenarios from the Scenario Comparison Report tab.
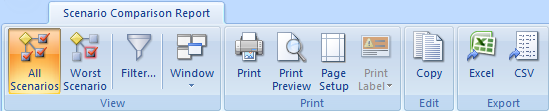
Figure 1: Scenario Comparison Report Tab for Arc Flash
The red 'X' identifies the worst case scenario for each bus.
Note: When the Short Circuit options are set to Both (Including and Excluding Main), the report behaves as though the Excluding Main option is selected. As a result, some buses may display zeroes on the report.
The Arc Flash Boundary column displays the highest arc flash boundary from all scenarios. If you are using the IEEE 1584-2018 standard and a scenario has the highest arc flash boundary but is not also the highest incident energy, the Arc Flash Boundary value displays an asterisk in this column to indicate this condition.
When printing arc flash labels from this report, the program uses the Arc Flash Boundary value as shown on the on-screen grid. It is important to recognize whether you are viewing All Scenarios or the Worst Scenario when you print labels from the report.
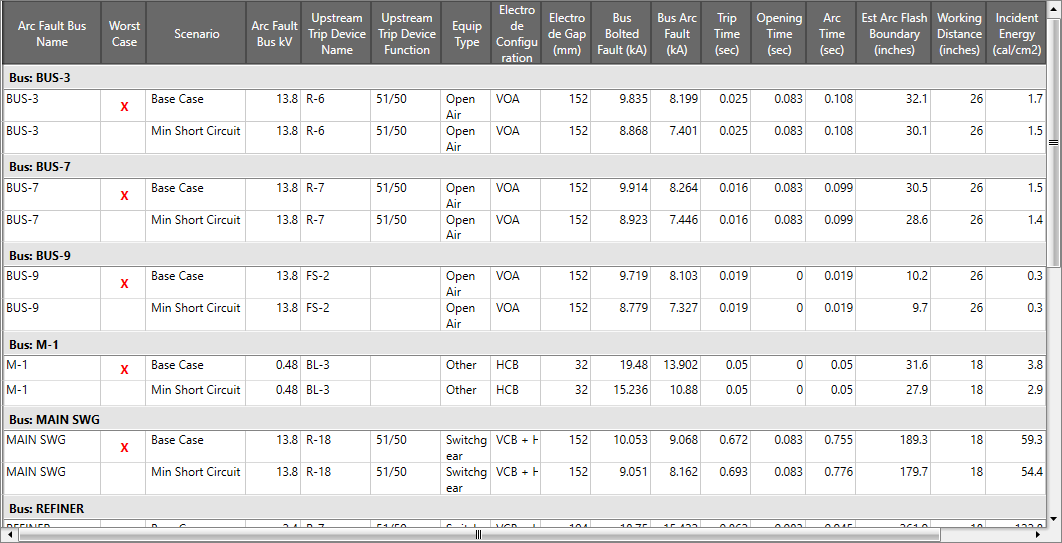
Figure 2: Viewing All Scenarios for Each Bus
When viewing the worst case for each bus, the report adjusts to display only the worst case scenario for each bus.
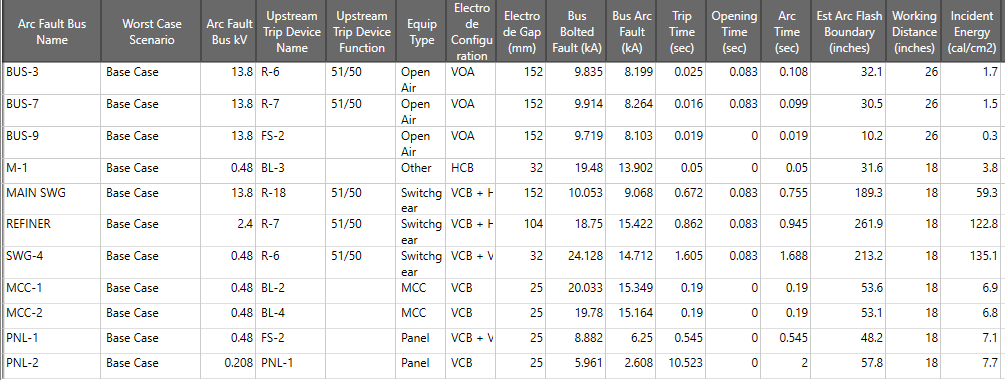
Figure 3: Viewing Only the Worst Case for Each Bus
More Information
- Scenario Manager
- Scenario Comparison Reports
- Scenario Comparison Report Settings
- Spreadsheet Column Headings
- Scenario Comparison Report Options
- Equipment Groups
- Scenario Groups
- Printing Arc Flash Labels
- Working with the Arc Flash Scenario Comparison Report
- Error Reports for the Scenario Comparison Report