Working with the Arc Flash Scenario Comparison Report
The Arc Flash Scenario Comparison Report contains the buses and scenarios based on your selections in the one-line and in the Scenario Comparison Report Options dialog box (see Scenario Comparison Report Options). The base case is listed first, and then the scenarios are listed alphabetically. The scenario that has the highest incident energy for any bus is identified as the “worst case” for that bus.
You can print this report, export it to Excel, export it to a CSV file, or print arc flash hazard warning labels from this spreadsheet view.
The columns on this report are similar to those for the Arc Flash Hazard Spreadsheet. See Spreadsheet Column Headings for more information.
Views
The Arc Flash Scenario Report includes a Default view. In this view, the boundary distance units for arc flash are set to inches and a predetermined selection of available columns are displayed.
The Arc Flash Scenario Report also has configurable views. This enables you to select the boundary distance units and the columns that appear in the report.
To add a new view:
- In the Scenario Comparison Report Options dialog box, next to View, click
 Manage Views to open the Manage Arc Flash Views dialog box.
 - Click Add to create a new view.
- In Arc Flash View name, type the name of the view.
- In Boundary distance units, select the units to use in the view for the arc flash boundaries. You can choose from feet, inches, meters, or millimeters.
- In the Available columns area, select the columns that you want to appear in the view, and then click Add >. The columns you select appear in the Selected columns area.
- If you need to remove a column you have added, click Remove.
- When you are finished, click Save Changes.
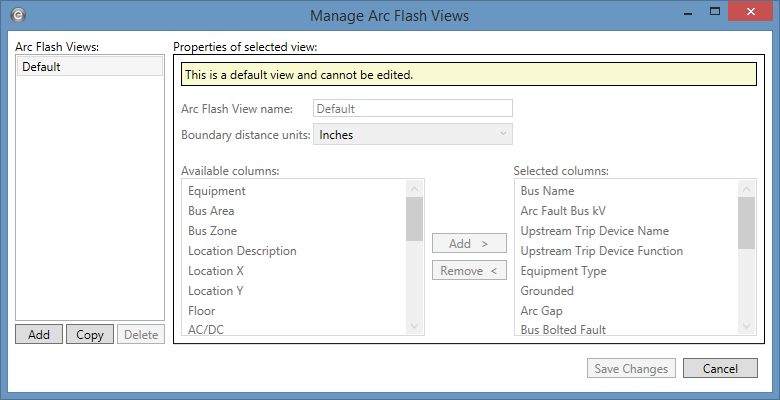
Figure 1: Manage Arc Flash Views Dialog Box
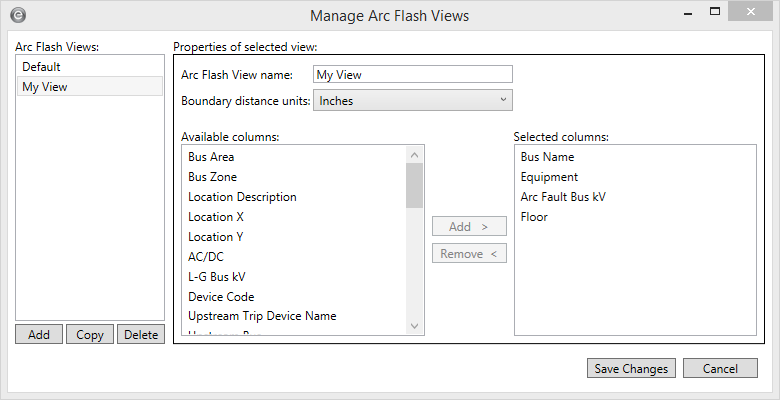
Figure 2: Manage Arc Flash Views - Adding a New View
Viewing All Scenarios or Only Worst Case Results
The Arc Flash Scenario Comparison Report can show either all scenarios for each bus or just the worst case scenario for each bus. To change the view, select either All Scenarios or Worst Scenarios from the Scenario Comparison Report tab.
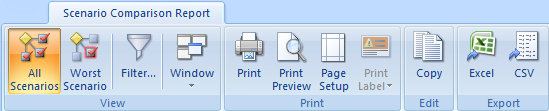
Figure 3: Scenario Comparison Report Tab for Arc Flash
The red 'X' identifies the worst case scenario for each bus.
Note: When the Short Circuit options are set to Both (Including and Excluding Main), the report behaves as though the Excluding Main option is selected. As a result, some buses may display zeroes on the report.
The Arc Flash Boundary column displays the highest arc flash boundary from all scenarios. If you are using the IEEE 1584-2018 standard and a scenario has the highest arc flash boundary but is not also the highest incident energy, the Arc Flash Boundary value displays an asterisk in this column to indicate this condition.
When printing arc flash labels from this report, the program uses the Arc Flash Boundary value as shown on the on-screen grid. It is important to recognize whether you are viewing All Scenarios or the Worst Scenario when you print labels from the report.
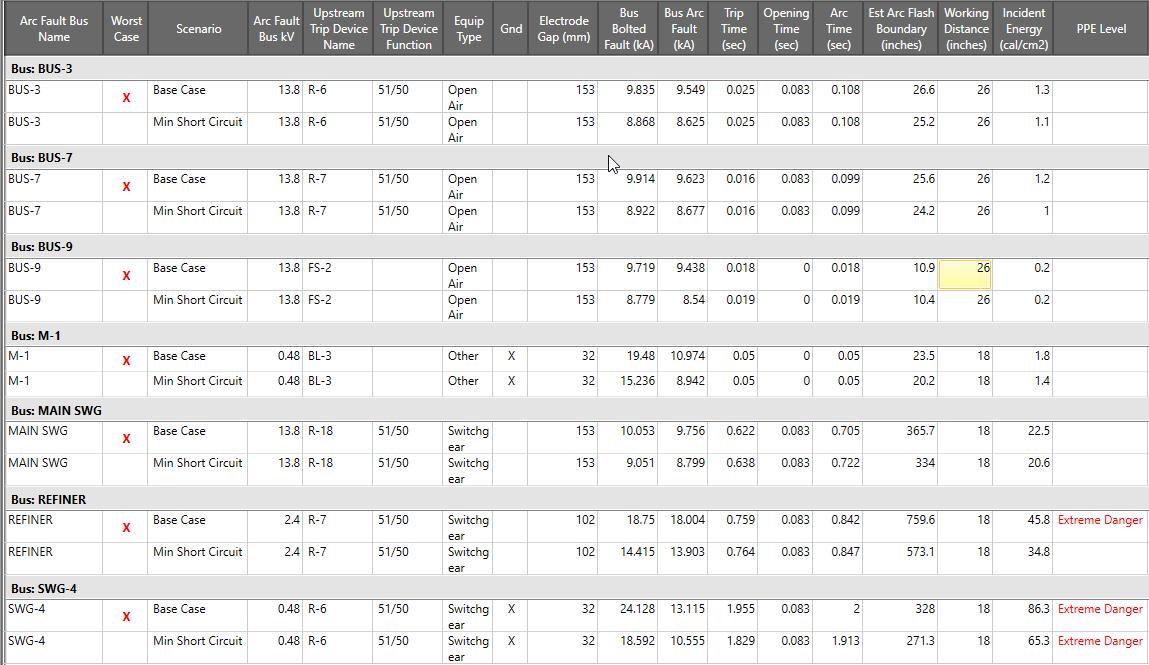
Figure 4: Viewing All Scenarios for Each Bus
When viewing the worst case for each bus, the report adjusts to display only the worst case scenario for each bus.
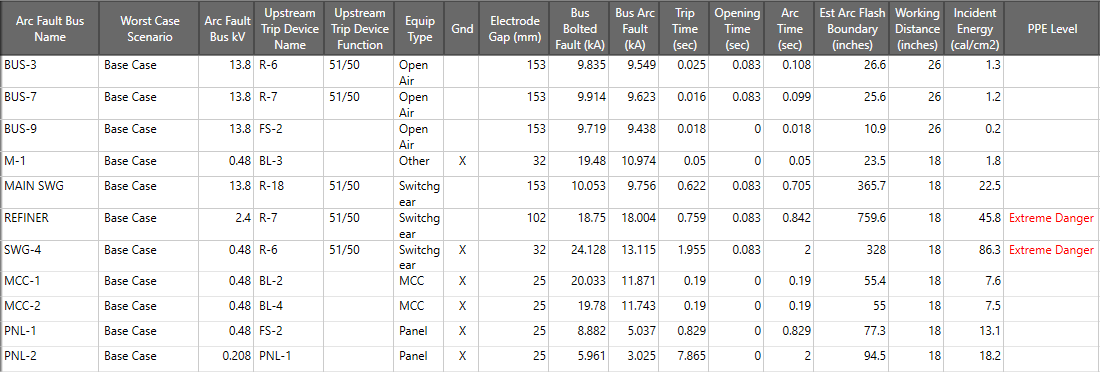
Figure 5: Viewing Only the Worst Case for Each Bus
Removing Equipment Results from the Spreadsheet
To remove any faulted bus or equipment from view on the spreadsheet, right-click on any spreadsheet cell related to the bus or equipment and select Hide Equipment.
Note: To show equipment you have hidden on the spreadsheet, run the report again.
Filtering Results from the Spreadsheet
You can filter the results shown in the spreadsheet by clicking  Filter.
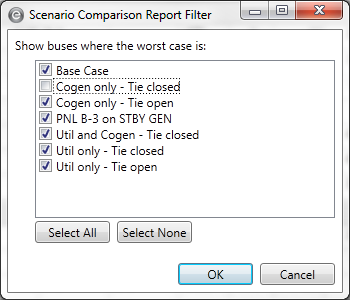
Figure 6: Scenario Comparison Report Filter
You can use the filter option to limit which buses are shown in the report, based on which scenario is the worst case scenario for the bus. For example, if you expect a particular scenario to be the worst case scenario for all of the buses, you might want to show only buses that have other scenarios as the worst case. This helps you find exceptions to the expected results.
Using Find
The Find feature locates specific text within the spreadsheet. As you begin typing, the program searches the spreadsheet for text that matches the text you enter. The search is not case-sensitive, but the character order must match. For example, searching ATS and ats displays the same results, but ATS 4 and ATS 04 displays different results.
The text is highlighted in the spreadsheet, and the number of occurrences where the text appears in the spreadsheet is displayed to the right of the Find box.

Figure 7: Finding Text
Copying Spreadsheet Data
You can copy information to the clipboard and then paste it into another document, such as Microsoft Word® or Excel®.
First, select the cells you want to copy, and then click  Copy.
Copy.
Removing Columns from the Spreadsheet
To remove any result columns from the spreadsheet, right-click on the column header and select Hide Column.
Note: To show columns you have hidden on the spreadsheet, run the report again.
Exporting the Spreadsheet to Excel®
You can export the scenario comparison report to Excel® by clicking Excel in the Export group.

Figure 8: Export to Excel® Button
This opens the report information in a Microsoft Excel file. You can view, edit, and modify the data there.
Note: Any changes you make to the report information in Excel are not written back to EasyPower.
Exporting the Spreadsheet to a CSV File
You can export the scenario comparison report to a CSV (comma separated value) file by clicking CSV in the Export group.

Figure 9: Export to CSV
This opens a dialog box where you can save the report information in a CSV file. You can then view, edit, and modify the data there.
Note: Any changes you make to the report information in the CSV file are not written back to EasyPower.
Printing the Scenario Comparison Report
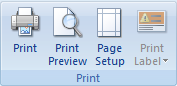
Figure 10: Scenario Comparison Report Print Menu - Arc Flash
- To print the report to a printer, click Print. You can select options such as your printer, the page range, and the number of copies prior to printing.
- To see a print preview of the report, click Print Preview. You can print the report or adjust the page layout from within the preview.
- To set up the page layout, click Page Setup. You can set up options such as page size and orientation here.
You can also print arc flash labels from the spreadsheet information. See Printing Arc Flash Labels for more information.