Working with the Equipment Duty Scenario Comparison Report
The Equipment Duty Scenario Comparison Report contains the equipment and scenarios based on your selections in the one-line and in the Scenario Comparison Report Options (see Scenario Comparison Report Options). The information on the report is grouped by bus name and then by equipment name.
You can print the report, export it to Excel, or export it to a CSV file from this spreadsheet view.
Report Purpose
Normal configurations may have tie breakers open and buses fed from single feeds. During transition to a different switching configuration, such as during maintenance or an emergency/alternate supply, there may be brief moment that a bus may be fed from multiple sources. If a fault occurs in that state, the fault currents can be higher than in normal configurations. Power flow and arc flash will not require this transient configuration to be modeled as a scenario. However, it is important to evaluate this condition for short circuit duty as the equipment is required to withstand or interrupt the fault currents. The Equipment Duty Scenario Comparison report allows you to compare different configurations and identify the worst-case duty.
Best and Worst Case Calculations
For each scenario, the program determines either:
- (ANSI) The higher of the 1/2 cycle duty percentage or interrupting duty percentage
- (IEC) The higher of the initial duty percentage or breaking duty percentage
The best case scenario is the one with the lowest calculated percentage.
The worst case scenario is the one with the highest calculated percentage.
Note: "Interrupting duty" refers to 5 cycle ANSI short circuit currents. ANSI has ½ cycle, 5 cycle, and 30 cycle short circuit currents. “Breaking duty” is used for IEC. EasyPower uses the following breaking currents for IEC: 0.02, 0.05, 0.10, and 0.25 seconds.
Viewing Best Case or Worst Case Results
The Equipment Duty Scenario Comparison Report can show either the best-case or the worst-case scenario for the selected equipment. This is determined by the view you select when you run the report.
- Best Case: This option is useful when you are designing a new system. You can determine the best-case scenario for the design.
- Worst Case: This option is useful when you are evaluating an existing system. You can identify problem areas in the design.
You can then modify the views further by selecting the various View buttons on the Scenario Comparison Report tab.
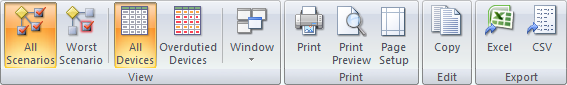
Figure 1: Scenario Comparison Report Tab for Equipment Duty - Worst Case
There are two pairs of view options that work together to control the information that appears in the report: Scenarios and Devices.
Scenarios
- All Scenarios: When selected, the report displays the results of all scenarios. The red 'X' in the Worst Case or Best Case column identifies the worst case or best-case scenario of all the scenarios listed, based on the equipment duty rating.
- Worst/Best Scenario: The button name reflects the view you selected when you ran the report (Worst or Best Scenario). When selected, the report is filtered to only display the worst or best scenario, depending on the selected view.
Devices
- All Devices: When selected, the report displays the results of all devices, regardless of whether they are in violation or have a warning status.
- Overdutied Devices: When selected, the report is filtered to display only the overdutied equipment items (those that are in violation or that have a warning status due to the threshold settings—see Short Circuit Options).
The All Scenarios and Worst/Best Scenario buttons are used in conjunction with the All Devices or Overdutied Devices buttons to filter the results. Examples of the report with various combinations selected are shown below.
This report shows all scenarios with the best case identified:
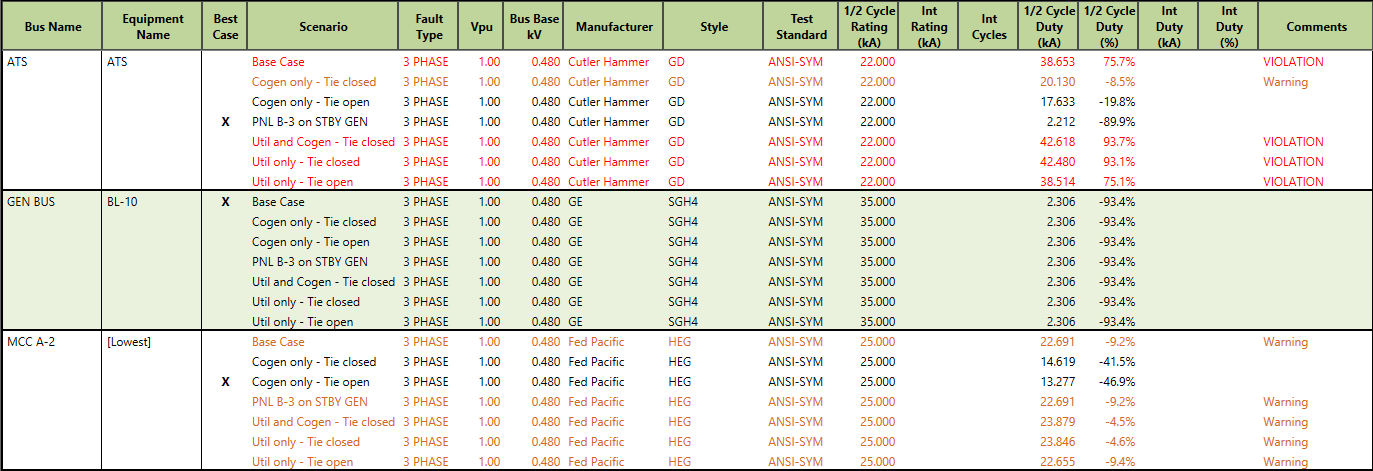
Figure 2: Equipment Duty Scenario Comparison Report - All Scenarios with Best Case Indicated
This report shows only the best-case scenarios:
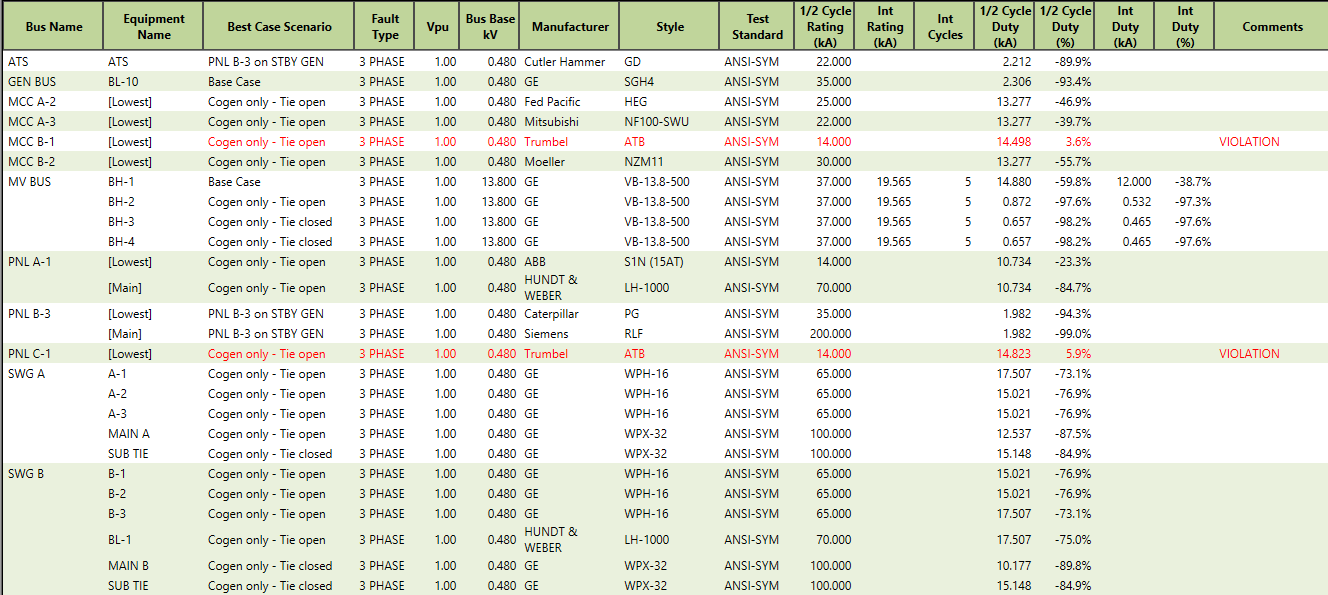
Figure 3: Equipment Duty Scenario Comparison Report - Filtered to Display Only Best Case, Best Scenario
This report shows all scenarios with the worst-case scenario identified:
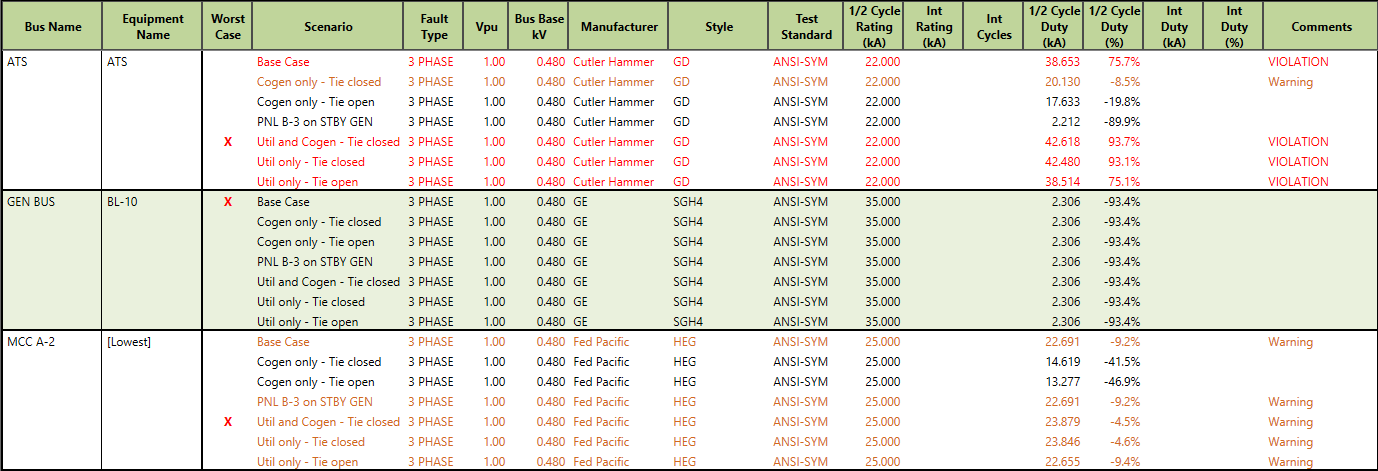
Figure 4: Equipment Duty Scenario Comparison Report - All Scenarios with Worst Case Indicated
This report shows only the worst-case scenarios:
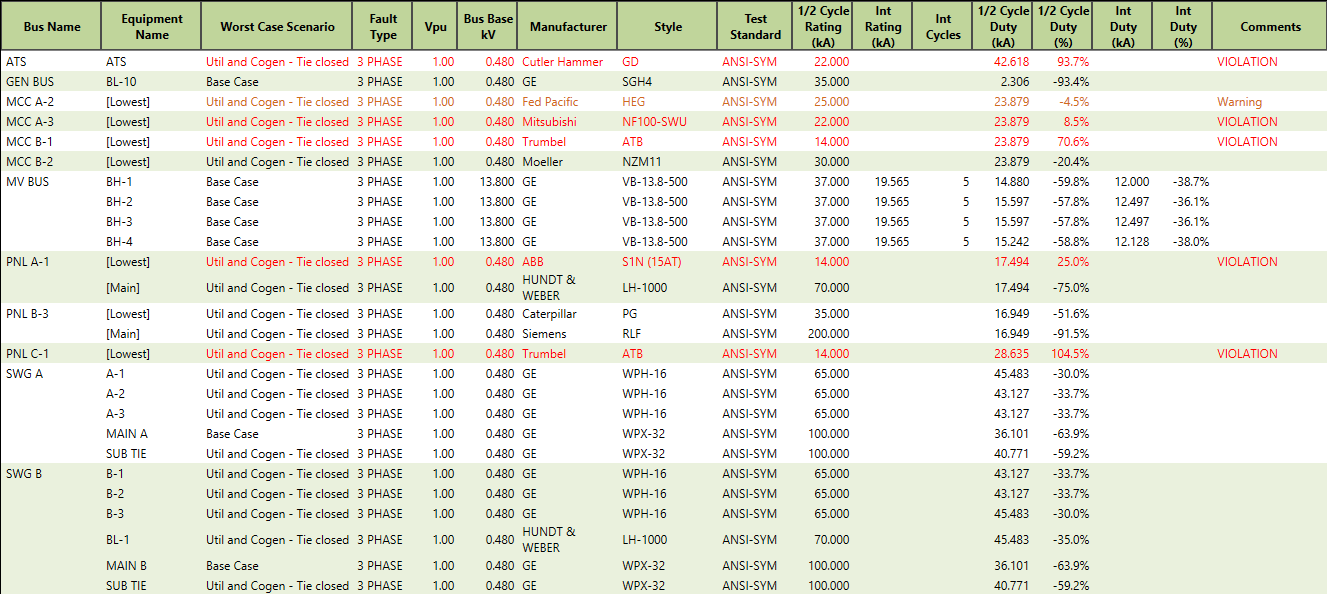
Figure 5: Equipment Duty Scenario Comparison Report - Filtered to Display Only Worst Case, Worst Scenario
Report Differences Between ANSI and IEC
The Equipment Duty Scenario Comparison Report includes slightly different information depending on whether your short circuit calculation method in system options is set to ANSI or IEC. See Short Circuit Options for more information about setting the calculation method.
ANSI
The ANSI version of the report displays a Vpu column (voltage per-unit). Momentary cycles are reflected in the 1/2 cycle columns. For high-voltage breakers, interrupting cycles are displayed in the Int (interrupting) columns. Interrupting cycles are measured as a number of cycles.

Figure 6: Equipment Duty Scenario Comparison Report - ANSI Version
IEC
The IEC version of the report displays a C Factor column (voltage correction factor). Momentary cycles are reflected in the Initial columns. For high-voltage breakers, interrupting cycles are displayed in the Breaking columns. Breaking times are measured in seconds.

Figure 7: Equipment Duty Scenario Comparison Report - IEC Version
See System Options for more information.
Using Find
The Find feature locates specific text within the spreadsheet. As you begin typing, the program searches the spreadsheet for text that matches the text you enter. The search is not case-sensitive, but the character order must match. For example, searching ATS and ats displays the same results, but ATS 4 and ATS 04 displays different results.
The text is highlighted in the spreadsheet, and the number of occurrences where the text appears in the spreadsheet is displayed to the right of the Find box.

Figure 8: Finding Text
Copying Spreadsheet Data
You can copy information to the clipboard and then paste it into another document, such as Microsoft Word® or Excel®.
First, select the cells you want to copy, and then click  Copy.
Copy.
Removing Columns from the Spreadsheet
To remove any result columns from the spreadsheet, right-click on the column header and select Hide Column.
Note: To show columns you have hidden on the spreadsheet, run the report again.
Exporting the Spreadsheet to Excel®
You can export the scenario comparison report to Excel® by clicking Excel in the Export group.

Figure 9: Export to Excel® Button
This opens the report information in a Microsoft Excel file. You can view, edit, and modify the data there.
Note: Any changes you make to the report information in Excel are not written back to EasyPower.
Exporting the Spreadsheet to a CSV File
You can export the scenario comparison report to a CSV (comma separated value) file by clicking CSV in the Export group.

Figure 10: Export to CSV
This opens a dialog box where you can save the report information in a CSV file. You can then view, edit, and modify the data there.
Note: Any changes you make to the report information in the CSV file are not written back to EasyPower.
Printing the Scenario Comparison Report
Figure 11: Scenario Comparison Report Print Menu - Arc Flash
- To print the report to a printer, click Print. You can select options such as your printer, the page range, and the number of copies prior to printing.
- To see a print preview of the report, click Print Preview. You can print the report or adjust the page layout from within the preview.
- To set up the page layout, click Page Setup. You can set up options such as page size and orientation here.