Frequency Scan
Frequency scans show how a system under study responds to an injected current at increasing frequency. The output of a frequency scan is a plot of per unit voltages, per unit currents, or both. From these plots, you can derive results such as voltage and current amplification, resonant points, and natural filter points. Frequency scanning utilizes a 1.0 per unit current injection at a single, user-selected location. Since Z=V/I, a 1.0 per unit current makes Z=V. Therefore, the bus voltage at the point of injection is the driving point impedance.
To obtain a frequency scan at a bus by injecting current at the same bus, double-click on the bus while in the Harmonics focus. This displays a window with a plot and spreadsheet as shown below. To obtain a frequency scan at a bus by injecting current at another bus, you need to define plots. The scan of bus at which current is injected appears on the AutoPlot tab.
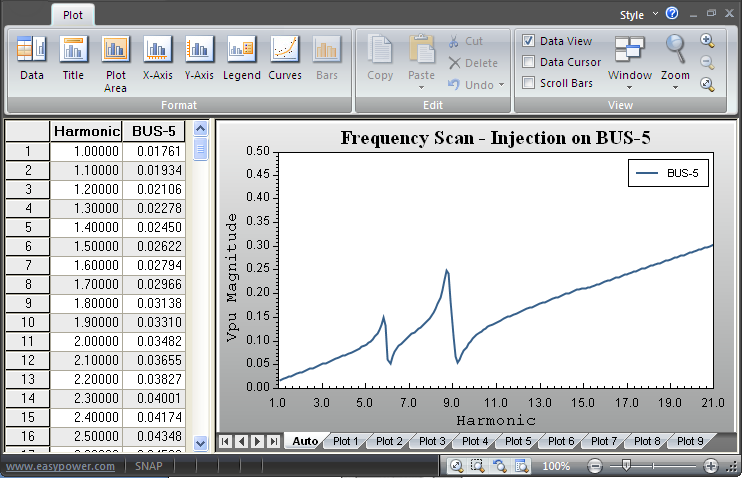
Figure 1: Frequency Scan at a Bus
The plot feature in the Harmonics focus enables you to select as many as ten plots with up to five buses or items each. For buses, the per-unit voltage is plotted; and for branch items, the per unit current is plotted.
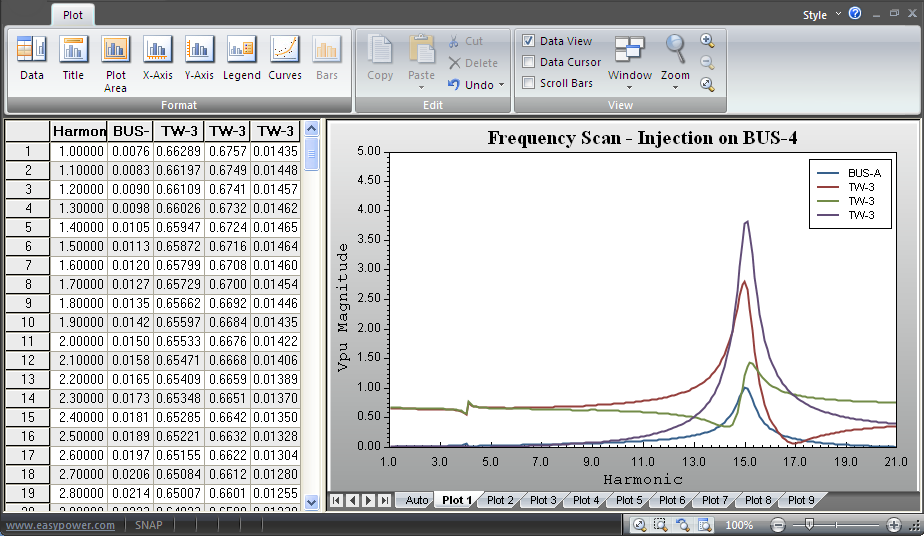
Figure 2: Plot Viewing Window